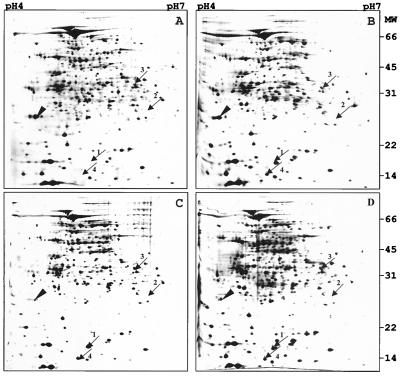
FIG. 4.
Steady-state levels of dormancy-induced proteins in aerated roller bottle cultures. Protein extracts were prepared at the time points (A to D) indicated by the arrows in Fig. 1. Samples of total protein (100 μg) were prepared from ≈25 ml of culture at time point A and ≈10 to 15 ml of culture at time points B to D and were subjected to two-dimensional electrophoresis. Panels A to D show silver-stained gels corresponding to the four time points. Arrows 1 to 4 indicate the migration areas of the dormancy-induced protein spots shown in Fig. 2. The arrowhead shows the 22-kDa alkyl hydroperoxide reductase found to be down-regulated in the aerated stationary phase. Molecular masses (MW) are indicated in kilodaltons. The experiment was carried out four times with the same results.

