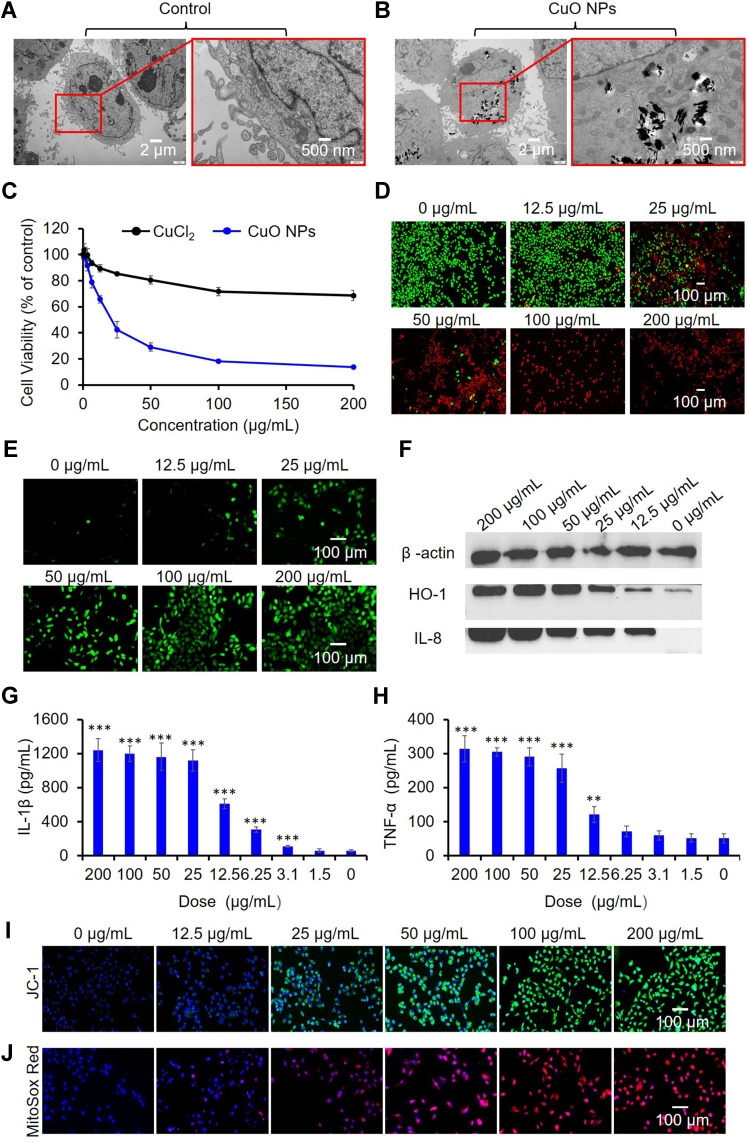
Figure 4.
Cytotoxicity and underlying mechanism of CuO NPs in AC16 cells. (A) TEM images of AC16 cells before exposure and (B) after exposure to 25 μg/mL CuO NPs for 6 h. (C) Effects of Cu ions (CuCl2) and CuO NPs on the viability of AC16 cells. Cells were exposed to serial concentrations (0, 0.4, 0.8, 1.5, 3.1, 6.25, 12.5, 25, 50, 100, and 200 μg/mL) Cu ions or CuO NPs, and cell viability was assessed using the CCK-8 assay. (D) Live/dead staining of AC16 cells. The live and dead cells were stained with calcein AM (green) and PI (red), respectively. (E) CLSM images of AC16 cells to detect intracellular ROS (DCF, green). (F) Western blots of HO-1 and IL-8 expression. (G and H) ELISA analysis of IL-1β and TNF-α production. ** p < 0.01, *** p < 0.001 vs control. CLSM images showing (I) mitochondrial membrane depolarization (JC-1, green) and (J) elevated superoxide generation (Mitosox Red, red). Cell nuclei were stained with DAPI (blue). From D to J, AC16 cells were treated with CuO NPs at 200, 100, 50, 25, 12.5 and 0 μg/mL for 6 h.

