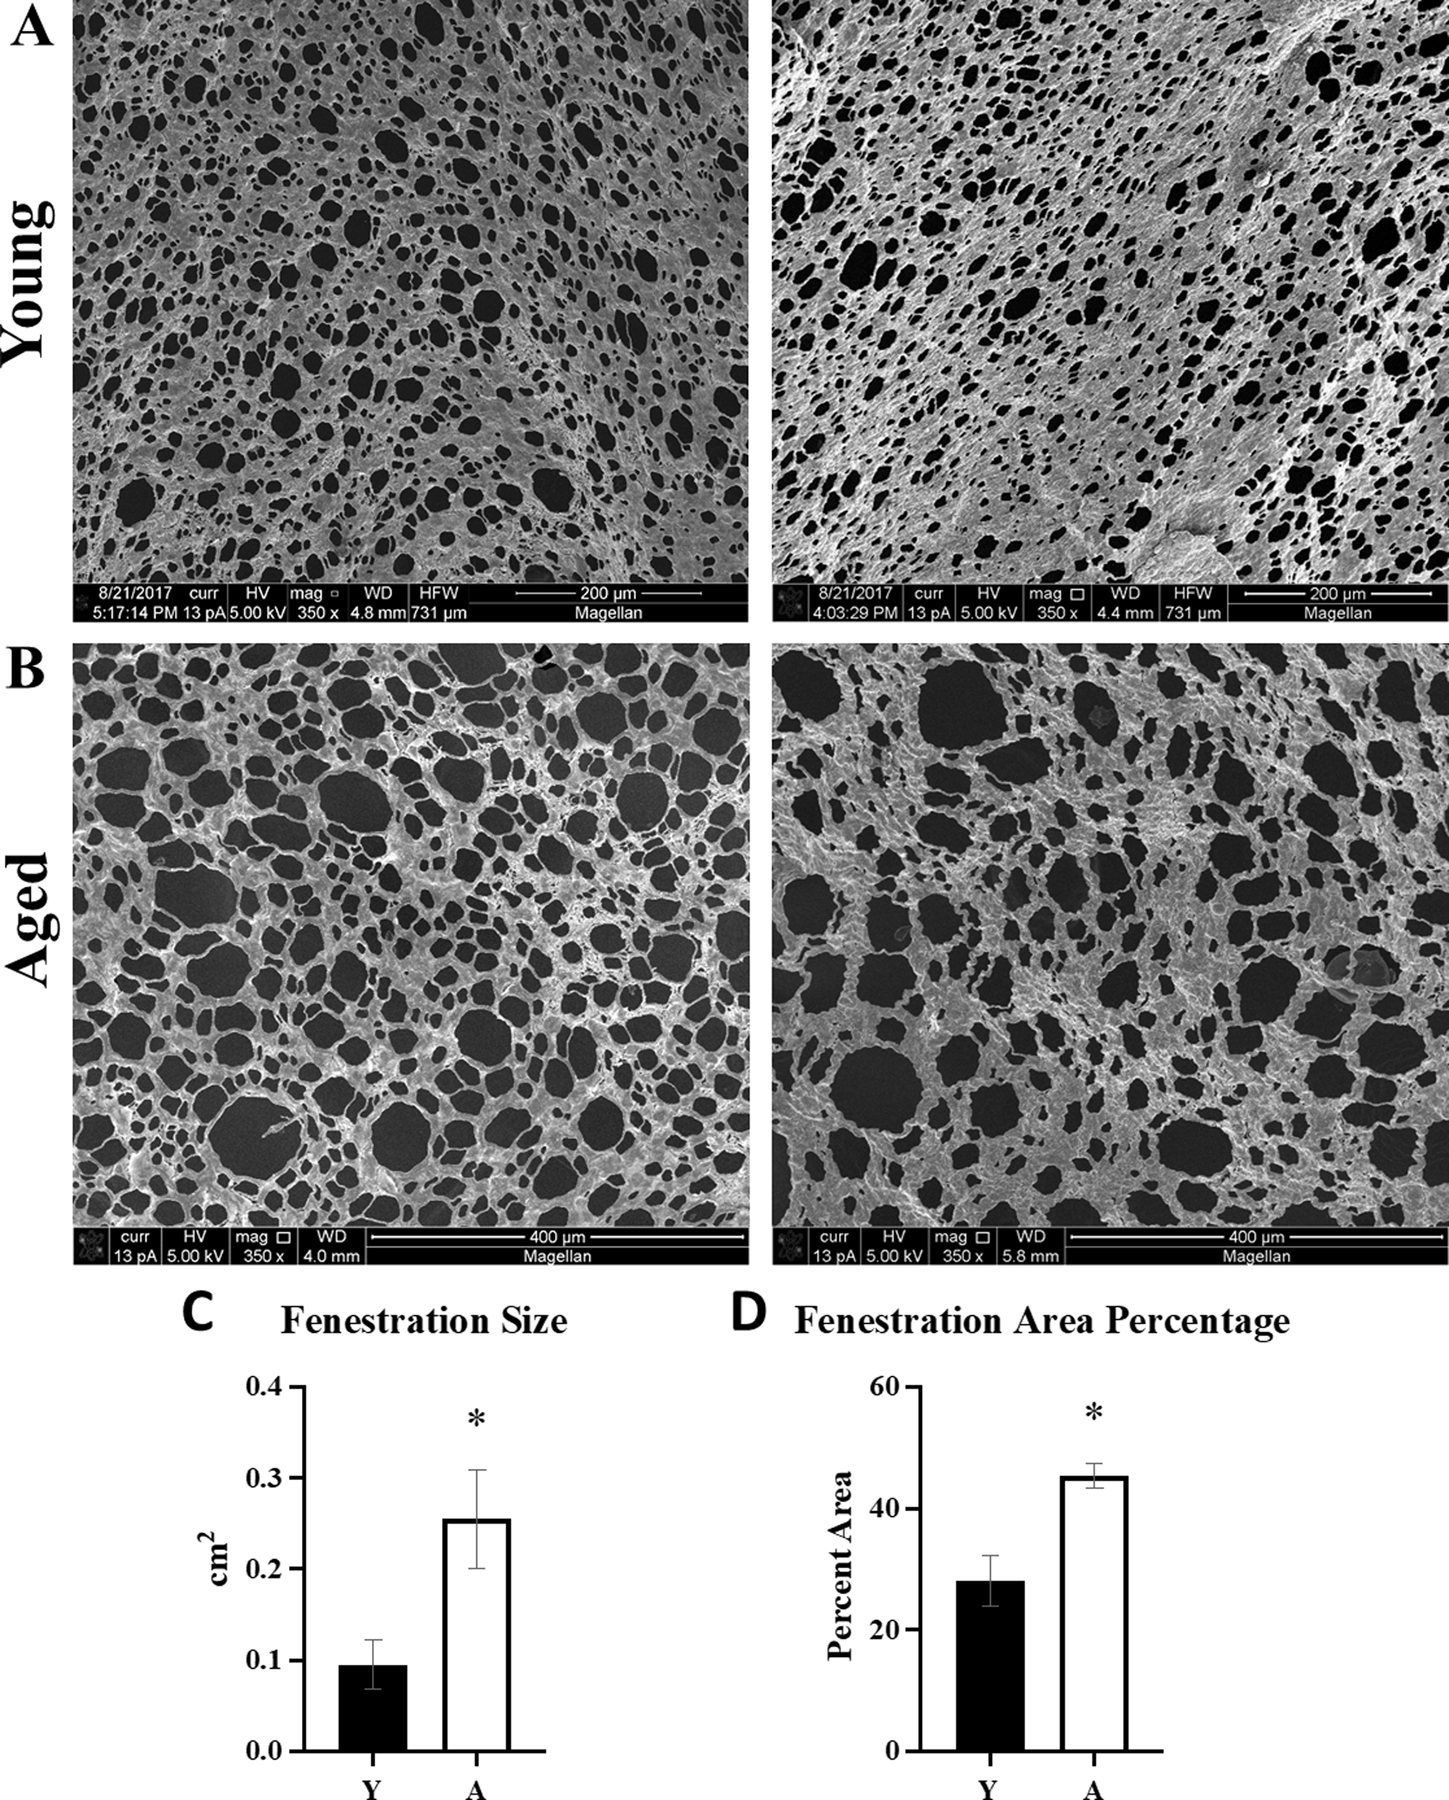
Figure 6. Analysis of omental fenestration in young vs aged mice.

Tumor-naive omenta (n=5) were obtained from (A) young (Y) or (B) aged (A) FVB/NJ mice and the collagen was imaged with SEM. Images were analyzed with ImageJ for (C) size of the fenestrations in the aged tissue as compared to young (p=0.03), and (D) overall area of the tissue represented by the fenestrations in aged compared to young (p=0.005). Error bars represent standard error of mean and p-values were determined by Student’s t-test.
