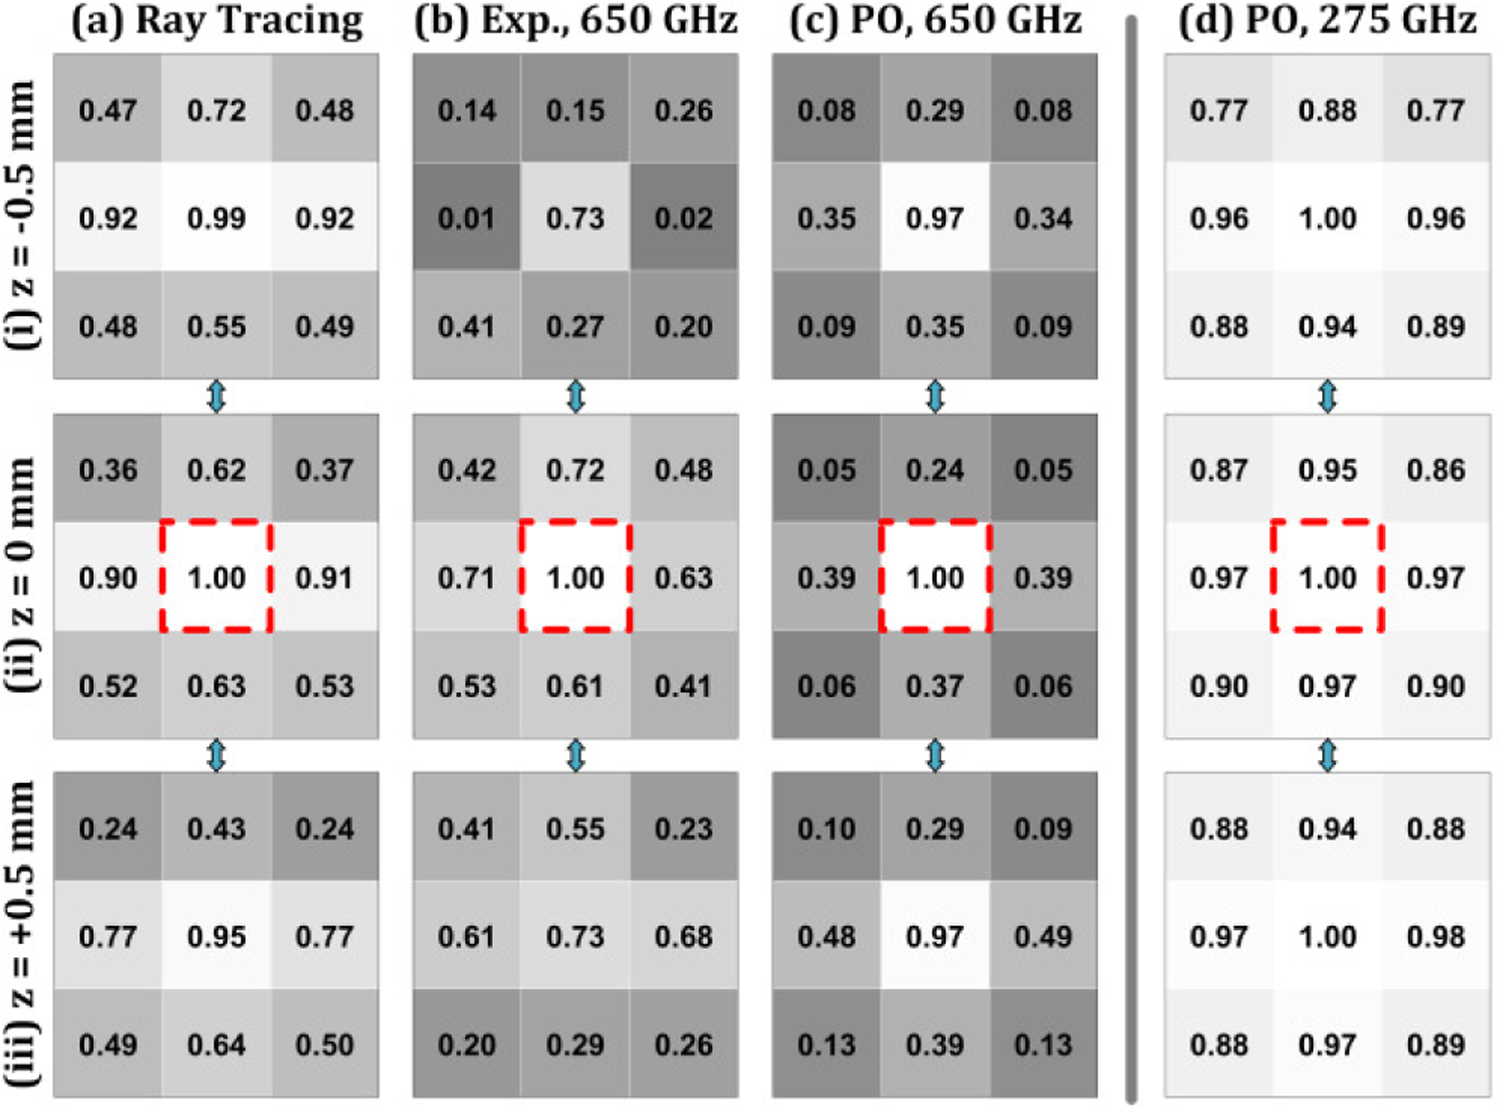
Figure 16.

Mean Structural Similarity Index Measure (MSSIM) analysis of image results in Figure 13. The modalities are arranged in columns (a-d) and the axial location of each transverse plane in rows (i-iii). The MSSIM score is housed in a box with a grayscale colormap ranging from 0 to 1. Each modality uses its own (0,0,0) image as the template.
