

Abstract
Background:
The diagnosis of chronic conditions in women is complicated by the historical androcentricity in medical research. Sex and gender gaps in health research may translate to unequal healthcare for women. This cross-sectional survey study aimed to ascertain the median time to diagnosis, proportions of rediagnosis and time to rediagnosis for Australian women with chronic conditions.
Methods:
An online survey collected anonymous data from voluntary participants. Data were analyzed using Stata14. Cox Proportional Hazards model was used to analyze time to diagnosis and rediagnosis. Logistic regression analysis was used to assess the significance of rediagnosis rates by diagnosis, age at diagnosis, income, employment, state of residence, disability status, and Indigenous status.
Results:
The median time from first appointment to initial diagnosis was 6 months (range 1 day–50 years) (interquartile range [IQR] 3.74 years). The median time to rediagnosis was 4 years (IQR 9) with a range of 1 day–43 years. Almost half of the women (n = 161/343, 47%) reported their primary condition being rediagnosed. From the complete responses, 40% were rediagnosed from one organic condition to another organic condition, however, 32% of women originally diagnosed with psychological, medically unexplained syndromes, or chronic pain were later rediagnosed with organic conditions.
Conclusion:
Median wait times for a diagnosis for women in Australia, when factoring in high rates of rediagnosis and time to rediagnosis, was 4 years. It is important that clinicians are aware of the high rediagnosis rates in female patients with chronic conditions and understand the potential impact of systemic biases on the diagnostic process for women under their care.
Keywords: diagnosis, chronic conditions, women's health, misdiagnosis
Background
Diagnosis of disease in women is complicated by the androcentric history of medical research,1 and systemic and societal gender biases.2,3 Previously, women's health has been under-researched, and results obtained from studies of male bodies have been assumed to apply to females.4,5 Assuming females and males to be the same is flawed and studies have demonstrated physiological,6 hormonal,7,8 microbiotal,9 and socioeconomic differences10 that impact upon women's health, symptoms,11 test results, and responses to treatment.12 Despite this, many studies continue not recruiting enough women13 and many more studies do not analyze their results by sex and/or gender.14
A recent cross-sectional analysis demonstrated that while across all clinical research in Australia, female participation was 55%, when analyzed by medical specialty, certain specialty areas over- and under-represented women.13 Perception of disease, rather than actual sex prevalence may drive representation of women in medical research.15 If this is the case, it could become a self-fulfilling prophecy, whereby under-diagnosis of some conditions in women enhances the perception of those conditions as male dominated, leading to lower recruitment of women into clinical trials pertaining to that condition.
Conditions with female predominance such as fibromyalgia16; myalgic encephalomyelitis/chronic fatigue syndrome (ME/CFS)17; autoimmune conditions, for example, systemic and cutaneous lupus erythematosus (collectively referred to from herein as lupus) and rheumatoid arthritis18; postural orthostatic tachycardia syndrome (POTS)19; vulvodynia; and endometriosis receive less research funding than diseases, such as heart disease, cancers, dementia, and—more recently—coronaviruses.20 Lack of funding has ongoing impacts on clinical knowledge regarding pathophysiology, presentation, treatment options, and responses to treatments that may have significant impact on women's health.21
Additionally, several of these female-dominated conditions are considered to be diagnoses of exclusion when all radiology and laboratory results are normal or nonspecific.22 These conditions may be termed as “psychogenic,” “medically unexplained symptoms” (MUS), or “functional”.23 The reality of these conditions may well be that owing to limited research funding, we simply do not yet know the pathogenesis, rather than the conditions being largely or entirely psychological in origin. Gender biases may also enhance the appearance of some conditions as being female dominated. Katz et al surveyed American rheumatologists and uncovered a gender bias in the diagnosis of fibromyalgia, with physicians being more likely to seek a more accepted organic disease in male patients.3
Studies have shown that sex and gender differences are also largely excluded from medical education materials, such as clinical and anatomical textbooks and medical school course outlines and curricula.12,24–27 A previous review of sex/gender representation in anatomy textbooks determined that imagery remains male centered.26 Consequently, students may come to view the male body as the norm, and the female body as “abnormal.” Additionally, students may become less confident with female anatomy and examinations.28,29 Descriptions of women's symptoms as “atypical” compared with those of men exemplifies androcentricity in medicine and research.12
The sex and gender gaps in research and education may translate into real-life impacts and unequal health care for women. There are notable sex and gender differences in acute care; women wait longer in the Emergency Department for a diagnosis30 and for adequate analgesia.31 A large study outside of Australia noted that women wait longer than men for a diagnosis.32 Internationally, women are noted to frequently be misdiagnosed and then later rediagnosed.33 The average time to diagnosis and rates of rediagnoses are not yet documented for Australia and most studies pertain to individual, specific conditions rather than general chronic conditions. This study aimed to ascertain the median time from presentation to initial diagnosis, the proportion of women who were rediagnosed, the median time to rediagnosis and the impact of socioeconomic factors on time to diagnosis and rediagnosis.
Methods
A cross-sectional survey of Australian women was conducted online, hosted on the survey software Qualtrics. The survey was devised using guidelines from Kelly and Gurr; Valerie and Ritter and Letherby.31–33 All data collected were anonymous. Adults 18 years of age and older who were born and reside in Australia were included. Participants unable to understand and respond to written English were not included. The following data were collected: initial diagnosis; age at initial diagnosis; rediagnosis; time to rediagnosis; income; employment; state/territory of residence; Indigenous status; disability status; current age; and secondary diagnoses. A summary of the data collection tool is provided in Box 1.
Initial or primary diagnosis was defined as the first diagnosis that an individual received, and rediagnosis was defined as the ultimate diagnosis a condition was given, noting that some individuals had their condition rediagnosed multiple times before an ultimate diagnosis (at the time of survey) was received. Secondary diagnoses were defined as any separate diagnoses received after and alongside the initial diagnosis.
Data collection
Participants were recruited by convenience sampling via social media (Twitter and Facebook). The study was advertised using relevant hashtags and notices in relevant Australian support groups of chronic conditions, including: chronic pain; endometriosis; lupus; mast cell activation syndrome (MCAS); epilepsy; asthma; cancer; ME/CFS; fibromyalgia; depression; anxiety; Ehlers–Danlos syndrome (EDS); POTS; disability; and many more. Before completing the survey, participants were informed via the information leaflet that the topics discussed were sensitive and may cause some distress and subsequently that they may withdraw at any point until their survey is submitted. Human Research Ethics Committee approval from the James Cook University was obtained (H8547), and all participants provided informed consent.
Data analysis
The primary outcomes were the self-reported diagnosis, time to primary diagnosis and rediagnosis, and proportions thereof, in participants with one or more chronic conditions. The secondary outcomes were the associations of the primary outcomes with diagnosis, age at diagnosis, income, employment, disability status, and Indigenous status.
Data were analyzed using Microsoft Excel and the statistical software package Stata14. Descriptive statistics were used to summarize the data. To analyze time to event (diagnosis and rediagnosis) and association of any variables (diagnosis, age, income, employment, state/territory of residence, Indigenous status, and disability status), the Cox Proportional Hazards Model34 was used. Logistic regression analysis was used to assess significance of rediagnosis rates by diagnosis, age at diagnosis, income, employment, state of residence, disability status, and Indigenous status. Diagnoses were analyzed specifically if more than five people received the same label, and if fewer than five people were diagnosed with a condition, these were grouped by medical specialty.
Conditions that were very rare or unable to be categorized (e.g., a symptom rather than a diagnosis given) were grouped together as “unclear” or “rare.” As the diagnosis with the most definitive tests of all the common chronic conditions diagnosed in this sample, type 2 diabetes mellitus (T2DM) was selected as the reference group. Diagnoses were then grouped by the researchers into two categories, medical conditions that are traditionally considered to be “organic” such as heart disease, diabetes, autoimmune disease, and medical conditions that are traditionally considered to be psychological/psychosomatic, medically unexplained syndromes (MUS), or idiopathic chronic pain, such as ME/CFS, fibromyalgia, chronic regional pain syndrome, and mental illnesses. Researchers then assessed the proportion of “organic” diagnoses that were rediagnosed to MUS diagnoses and vice versa.
Regarding the question of rediagnosis, the survey contained three response options: “yes, the condition was rediagnosed,” “no, the condition was not rediagnosed” and “unsure.” Those unsure about their rediagnosis status were categorized as “no” for the purpose of this analysis with the rationale that there was no definitive rediagnosis timeline, and if an individual's condition had been fully rediagnosed, it was assumed the individual would be aware.
Results
There was a total of 467 responses. The demographic details of participants are summarized in Table 1.
Table 1.
Participants' Demographic Characteristics
| Demographic characteristics | Number of participants (%) |
|---|---|
| Indigenous status | |
| Aboriginal | 15 (3) |
| Torres Strait Islander | 2 (0.4) |
| Aboriginal and Torres Strait Islander | 2 (0.4) |
| Non-Indigenous | 435 (93) |
| Not stated | 13 (2) |
| State/territory of residence | |
| Australian Capital Territory | 20 (4) |
| New South Wales | 120 (26) |
| South Australia | 37 (8) |
| Queensland | 96 (21) |
| Northern Territory | 9 (2) |
| Tasmania | 19 (4) |
| West Australia | 25 (5) |
| Victoria | 139 (30) |
| Not stated | 2 (0.4) |
| Employment status | |
| Disability support or pension | 82 (18) |
| Full-time employed | 196 (42) |
| Part-time employed | 2 (0.4) |
| Self employed | 41 (9) |
| Unemployed | 31 (7) |
| Temporary employment | 10 (2) |
| Retired | 27 (6) |
| Full-time carer | 7 (1) |
| Student | 16 (3) |
| Other | 50 (11) |
| Not stated | 5 (1) |
| Current age range (years) | |
| 18–25 | 13 (3) |
| 26–35 | 104 (22) |
| 36–45 | 121 (26) |
| 46–55 | 129 (28) |
| 56–65 | 72 (15) |
| 66–75 | 18 (4) |
| 76+ | 3 (0.6) |
| Not stated | 7 (1) |
| Household weekly income after tax (AUD) | |
| 0–743 | 145 (31) |
| 744–1431 | 121 (26) |
| 1432–2433 | 104 (22) |
| 2434+ | 87 (19) |
| Not stated | 10 (2) |
| Disability status | |
| Disabled | 182 (39) |
| Not disabled | 186 (40) |
| Unsure | 97 (21) |
| Not stated | 2 (0.4) |
| Age range at initial diagnosis (years) | |
| 18–25 | 142 (30) |
| 26–35 | 97 (21) |
| 36–45 | 62 (13) |
| 46–55 | 36 (8) |
| 56–65 | 8 (2) |
| 66–75 | 1 (0.2) |
| 76+ | 0 (0) |
| Not stated | 121 (26) |
Box 1.
Summarized Data Collection Tool
| Age (years) Indigenous status State/Territory of current residence Name of closest town/city Employment status Household Income bracket (AUD) per week (after tax) Disability status/Identity First diagnosis (the one that was diagnosed chronologically first) Specialist who cares for first diagnosis (e.g., cardiologist). Number of other diagnoses List of other diagnoses Age at first diagnosis Time from first presentation with symptoms to first diagnosis Has the first condition been rediagnosed? Number of times the diagnosis changed Time from first diagnosis to rediagnosis Name of rediagnosed condition |
Diagnoses
Initial diagnoses were extremely varied and included common conditions such as asthma, T2DM, cardiac conditions, arthritis, and mental illnesses and some very rare conditions such as VACTERL syndrome, narcolepsy, Scheuermann's disease, and hidradenitis suppurativa. Eleven diagnoses were unclear or listed a symptoms, rather than a diagnosis. The most common 12 conditions reported as an initial diagnosis are presented in Table 2. These 12 diagnoses made up 168 (52%) of 325 responses to this question. The remaining conditions were grouped by specialty using classifications in the International classification of diseases (ICD-10),35 for analysis (Table 3).
Table 2.
Most Common Initial Diagnoses
| Initial diagnosis | Number of participants reporting (% of total) n = 325 |
|---|---|
| Endometriosis/adenomyosis | 29 (9) |
| Fibromyalgia | 27 (8) |
| ME/CFS | 24 (7) |
| SLE/cutaneous lupus/MCTD | 18 (5) |
| Autoimmune arthritis, including RA and psoriatic arthritis | 12 (4) |
| Depression | 11 (4) |
| POTS | 10 (3) |
| Chronic pain | 9 (3) |
| Anxiety | 9 (3) |
| IBS | 9 (3) |
| Chronic tonsillitis | 5 (2) |
| T2DM | 5 (2) |
IBS, irritable bowel syndrome; MCTD, mixed connective tissue disease; ME/CFS, myalgic encephalomyelitis/chronic fatigue syndrome; POTS, postural orthostatic tachycardia syndrome; RA, rheumatoid arthritis; SLE, systemic lupus; T2DM, type 2 diabetes mellitus.
Table 3.
Grouped Conditions
| Diagnosis (grouped by specialty) | Number of participants reporting (% of total, n = 325) |
|---|---|
| MSK conditions | 29 (9) |
| Neurological conditions | 18 (5) |
| Cardiac conditions | 14 (4) |
| Unclear | 12 (3) |
| Psychiatric conditions | 11 (3) |
| Gastrological conditions | 10 (3) |
| Thyroid conditions | 9 (3) |
| Gynecological conditions | 9 (3) |
| Hematological conditions | 8 (2) |
| Respiratory conditions | 8 (2) |
| Dermatological conditions | 8 (2) |
| Infective/viral conditions | 5 (2) |
| Endocrine conditions | 4 (1) |
| Cancers | 4 (1) |
| Renal conditions | 4 (1) |
| Rare conditions | 4 (1) |
MSK, musculoskeletal.
The median number of secondary diagnoses (in addition to the initial diagnosis) was 3 (interquartile range [IQR] 3, range 0–20). Secondary diagnoses were wide ranging and included EDS, lupus, mental illness, MCAS, fibromyalgia, ME/CFS, endometriosis, osteopenia, irritable bowel syndrome (IBS), inflammatory bowel disease, and cancers.
Time to initial diagnosis
The median and modal for time from first appointment to initial diagnosis was 6 months (range 1 day–50 years) (IQR 3.74 years). Kaplan–Meier survival analysis demonstrated 25% of participants received an initial diagnosis within 56 days (2 months), 50% by 168 days (6 months), and 75% by 1460 days (4 years) (Fig. 1).
FIG. 1.
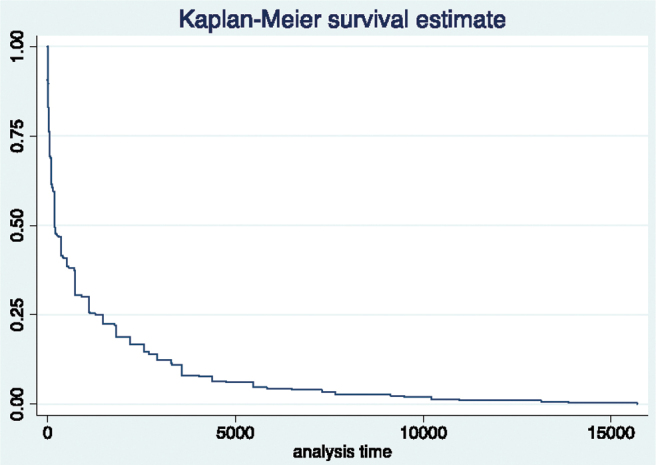
Kaplan–Meier survival estimate for event: time from presentation to a doctor with symptoms to initial diagnosis of the condition. Demonstrating time to diagnosis in days and proportion of women who received their diagnosis within this time.
Initial diagnoses that significantly delayed time to diagnosis were: anxiety, IBS, autoimmune arthritis, ME/CFS, migraine, endometriosis, fibromyalgia, chronic pain syndromes, lupus/mixed connective tissue disease, POTS, mental illness (category), cancers, neurological conditions, gastrological conditions, musculoskeletal conditions, thyroid conditions, gynecological conditions and cardiovascular conditions (Table 4). No initial diagnoses significantly shortened time to diagnosis. The only demographics to significantly impact the time to initial diagnosis were age bracket 36–45 years, which lengthened this time (coefficient −0.4228682, p = 0.05) and being on disability support pension or equivalent, which shortened the time (coefficient 0.4835686, p = 0.05). These results are summarized in the Supplementary Data.
Table 4.
Diagnoses That Significantly Delayed Time to Obtaining That Diagnosis in Surveyed Women with Chronic Conditions in Australia
| Diagnosis | Coefficient | SE | z | p > z | 95% CI |
|---|---|---|---|---|---|
| Anxiety | −1.340 | 0.614 | −2.18 | 0.029 | −2.544 to −0.137 |
| IBS | −2.711 | 0.625 | −4.33 | 0.000 | −3.937 to −1.485 |
| Autoimmune arthritis | −1.949 | 0.559 | −3.49 | 0.000 | −3.045 to −0.854 |
| ME/CFS | −2.797 | 0.526 | −5.32 | 0.000 | −3.828 to −1.766 |
| Migraine | −2.039 | 0.589 | −3.46 | 0.001 | −3.192 to −0.885 |
| Endometriosis | −3.126 | 0.536 | −5.83 | 0.000 | −4.177 to −2.076 |
| Fibromyalgia | −2.720 | 0.520 | −5.23 | 0.000 | −3.739 to −1.701 |
| Chronic pain | −2.444 | 0.629 | −3.88 | 0.000 | −3.677 to −1.211 |
| Lupus/MCTD | −2.273 | 0.535 | −4.25 | 0.000 | −3.321 to −1.225 |
| POTS | −2.619 | 0.640 | −4.09 | 0.000 | −3.874 to −1.363 |
| Mental illness | −2.402 | 0.726 | −3.31 | 0.001 | −3.825 to −0.978 |
| Cancers | −3.192 | 0.287 | −2.48 | 0.013 | −5.714 to −0.669 |
| Neurological | −2.370 | 0.564 | −4.20 | 0.000 | −3.476 to −1.265 |
| Gastrological | −2.354 | 0.613 | −3.84 | 0.000 | −3.555 to −1.153 |
| MSK | −2.311 | 0.553 | −4.18 | 0.000 | −3.394 to −1.228 |
| Thyroid | −2.036 | 0.630 | −3.23 | 0.001 | −3.271 to −0.801 |
| Gynecological | −2.449 | 0.587 | −4.17 | 0.000 | −3.600 to −1.297 |
| Miscellaneous | −2.021 | 0.567 | −3.57 | 0.000 | −3.132 to −0.910 |
| Infective/viral | −1.664 | 0.663 | −2.51 | 0.012 | −2.964 to −0.364 |
| Cardiology | −2.041 | 0.668 | −3.06 | 0.002 | −3.351 to −0.732 |
CI, confidence interval; SE, standard error.
Rediagnosis rate
Almost half of the women (n = 161/343, 47%) reported their primary condition being rediagnosed, a further 36 women were unsure if their condition had been rediagnosed or not (10%). Of those 161 women who had their primary condition rediagnosed, 58 (36%) women stated this had happened three or more times. Rediagnosis rates are presented in Table 5.
Table 5.
Rediagnosis Rates in Surveyed Women with Chronic Conditions in Australia
| Variable | Proportion | SE | 95% CI |
|---|---|---|---|
| Rediagnosed | 0.47 | 0.269 | 0.417–0.5226 |
| Not rediagnosed | 0.42 | 0.267 | 0.374–0.479 |
| Unsure | 0.11 | 0.166 | 0.076–0.142 |
Diagnosis, age at diagnosis, income, employment, state/territory of residence, disability status, and Indigenous status had no effect on rates of rediagnosis, however, residing in Tasmania was approaching significance (coefficient −1.67147, p = 0.06) (the Supplementary Data).
Time to rediagnosis
The median time to rediagnosis was 4 years (IQR 9) with a modal value of 1 year (range 1 day–43 years). Survival analysis demonstrated 25% of participants received a rediagnosis within 504 days (18 months), 50% within 1460 days (4 years), and 75% by 3650 days (10 years) (Fig. 2).
FIG. 2.
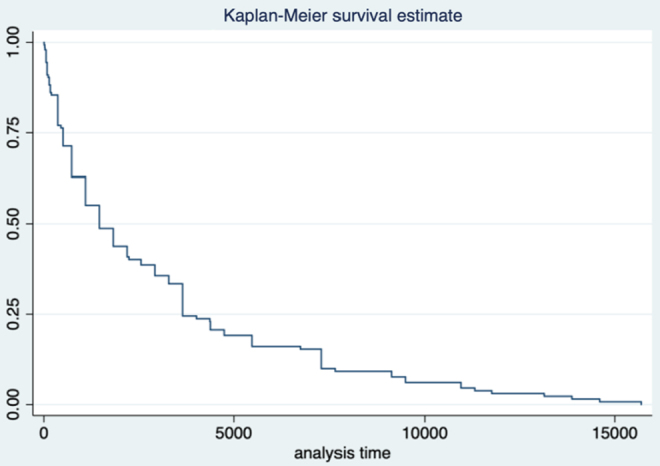
Kaplan–Meier survival estimate for event: time to rediagnosis. Demonstrating time to rediagnosis in days and proportion of women who received their rediagnosis within this time.
Of the 128 respondents who gave complete responses, including their original diagnosis and their rediagnosis, 40% (n = 51) were rediagnosed from one organic condition to another organic condition, however, 32% of women originally diagnosed with psychological, MUS, or chronic pain were later rediagnosed with organic conditions (Table 6). Diagnosis, age at diagnosis, income, employment, state/territory of residence, and disability status had no significant effect on time to rediagnosis, however, identifying as Torres Strait Islander was significantly associated with shorter time to rediagnosis (Supplementary Data), however, this is based on a sample of two participants.
Table 6.
Rediagnoses of Surveyed Women with Chronic Conditions in Australia Demonstrating the Number and Percentage of Women Who Were Initially Diagnosed with One Either Organic or Psychological/Medically Unexplained Syndromes Condition and Then Later Rediagnosed with a Different Condition
| Primary diagnosis group | Rediagnosis group | Number (%) n = 128 |
|---|---|---|
| Psychological, MUS, or chronic pain condition | Organic condition | 41 (32) |
| Organic condition | Psychological, MUS, or chronic pain condition | 17 (13) |
| Psychological, MUS, or chronic pain condition | Another psychological, MUS, or chronic pain condition | 19 (15) |
| Organic condition | Another organic condition | 51 (40) |
MUS, medically unexplained syndromes.
Discussion
Participants typically obtained an initial diagnosis within 6 months, however, 47% of women reported rediagnosis and a median period of 4 years between initial diagnosis and rediagnosis, indicating women are potentially waiting a long time for adequate treatment and risk progression of their condition. Additionally, there are potential risks associated with receiving treatment for an incorrect initial diagnosis.
Australian women with chronic disease participating in an online survey receive an initial diagnosis within 6 months
Our study determined a median diagnostic time of 6 months for women with chronic conditions in Australia, however, this ranged between 1 day and 50 years, and was accompanied by a high rate of rediagnoses, suggesting misdiagnosis of the initial condition. It is unclear why the 35–46-year age group at diagnosis was significantly associated with shorter time to diagnosis.
It is difficult to assess if 6 months is a lengthy duration to diagnosis as there are no comparative data on male times to diagnosis. A U.K. study defined a delay in cervical cancer diagnosis as a duration longer than 3 months from first presentation with symptoms to diagnosis.36 Lim et al observed a delayed diagnosis in 60% of symptomatic women.36 Another study noted delays in diagnoses for female patients with cystic fibrosis; compared with males, females experienced a 4-month delay in diagnosis in a large study of 11,275 cystic fibrosis patients.37 Conversely, cross-sectional analysis of 7,101 individuals with diabetes in Canada determined that proportionally more males are diagnosed late than females.38
Almost half of Australian women with chronic disease participating in an online survey have their initial condition rediagnosed at least once
This study ascertained that almost half of female patients with chronic disease are rediagnosed for at least one occasion. This is in keeping with findings from other studies. Focus groups with fibromyalgia patients report a long and stressful journey to diagnosis with high misdiagnosis rates.39 The 2012 National Health Interview Survey estimated that fibromyalgia is misdiagnosed, using surrogate markers, in about three quarters of respondents.40 According to the Lupus Foundation of America, a lupus (encompassing four different types of lupus: systemic, cutaneous, drug-induced and neonatal) diagnosis takes on average almost 6 years from first developing symptoms, with a high misdiagnosis or rediagnosis rate and an average of four different health care providers.41 This was supported by a 2018 U.K. survey of lupus patients, demonstrating an average time to diagnosis of 6.4 years, with 47% initially being misdiagnosed.
Our findings of high rediagnosis rates are in keeping with Geraghty and Blease, who found that 40% of referrals to one ME/CFS clinic were eventually diagnosed with another chronic or psychiatric illness.42 This narrative review of the literature also determined that patients with ME/CFS report frequent misdiagnosis of their condition, possibly related to guidelines that recommend against overinvestigation of ME/CFS patients as a drain on resources, leading to underdiagnosis.42 A review of 418 referrals to a specialist ME/CFS clinic revealed a 37% rejection rate owing to inappropriate referral and of those, 61% had a likely alternative diagnosis.42
Australian women participating in an online survey experience on average a 4 years wait for rediagnosis of their chronic condition
The median time to rediagnosis was 4 years. These findings are in keeping with the current literature. A large 2019 population study at the University of Copenhagen demonstrated that men are diagnosed with chronic conditions at comparatively younger ages than women, and that women on average waited 2–5 years longer than men to obtain a diagnosis.32 Rare or chronic conditions take on average 7.6 years to diagnose across both women and men in the United States of America and 5.6 years in the U.K., with patients visiting an average of eight physicians and receiving two to three misdiagnoses.43 There are however some areas that appear to have improved in this regard. A 2015 Danish study of autoimmune arthritis demonstrated a significant but decreasing time from presentation to diagnosis from 29 to 66 months in the year 2000 to 3 to 4 months by 2011.44 The discrepancy in diagnostic waiting times extends across all medical specialties even to Oncology, where even with higher cancer screening rates,45 women have longer diagnostic intervals for several cancers, including, but not limited to: bladder, colorectal, gastric, head and neck, lung, and lymphoma.46–48
Our findings of a lengthy time to a final diagnosis in women are possibly a sign of a sex and gender gap in medical care. Studies exploring specific chronic conditions have demonstrated that there is potentially a sex and gender difference in the time from presentation to a doctor with symptoms to receiving diagnosis. Hudson et al assessed the wait time in Canada between onset of Reynaud's phenomenon and the diagnosis of systemic sclerosis and diffuse cutaneous systemic sclerosis in female and male patients, determining that women's wait was significantly longer than that of men, however following other manifestations of illness, this wait time decreased to insignificance.49 This suggests support for the Yentl syndrome; a woman must prove herself at least as sick, if not more sick, than a male counterpart to receive diagnosis and treatment.50
The findings of this study suggest that women with female or female-dominated conditions experience a lengthy time to final diagnosis. In keeping with this, a 1996 study from the United States of America and United Kingdom demonstrated a diagnostic delay from presentation with symptoms to diagnosis of endometriosis to be an average of 11.73 and 7.96 years, respectively.51 Recent reports state that although this time is decreasing, the average wait time for diagnosis of this painful gynecological condition is still between 4 and 11 years.52,53 Similarly, despite lupus being a condition that predominantly affects females, a U.K. survey study reported a longer time to diagnosis in women than men (6.9 vs. 4.5 years, respectively).54 Women's protracted diagnostic journey for lupus also frequently included doctors diagnosing their symptoms as medically unexplained or psychosomatic.54
It is unclear why there is a lengthy duration among presentation, diagnosis, and subsequent rediagnosis in this study. Other studies have suggested that diagnostic delays may be, in part, due to patient anxiety and avoidance of medical appointments. A 2010 survey demonstrated that 38% of patients were afraid of their doctor not taking their symptoms seriously, thus delaying diagnosis.55 Despite observation of diagnostic delays in female-predominant conditions, surprisingly little work has been done to quantify this delay against male diagnostic times. This should be an area of further research, to better understand the sex and gender gaps in medicine and improve women's health.
Rediagnosis of chronic conditions in Australian women participating in an online survey most commonly follows the patterns of organic–organic and psychogenic–organic
This study found that a third of women who were rediagnosed were originally given a psychological or MUS diagnosis that was later rediagnosed as an organic illness. These findings perhaps signal a propensity to first diagnose women with psychological conditions before seeking the organic cause and have been observed in other studies. Utilizing a sample of 23 women recruited from online patient forums, Mendelson determined most women had experienced dismissal of their symptoms and refusal to refer them for further investigation, leading to misdiagnoses of lupus as medically unexplained, psychological, or fibromyalgia.56 Assessment of 50 patients with an MS diagnoses noted a misdiagnosis rate of 58%, with women particularly likely to have their symptoms initially misattributed to psychiatric conditions or medically unexplained symptoms and men more likely to be offered referral for orthopedic assessment.57
A retrospective survey of 107 patients with paroxysmal supraventricular tachycardia demonstrated that symptoms are unrecognized after initial medical examination in 55% of patients and that women were more likely than men to have their symptoms attributed to psychological causes such as panic and anxiety disorders (65% vs. 32% respectively).58 POTS is another chronic condition more prevalent in women than men, often associated with other disorders with orthostatic intolerance such as dysautonomia or EDS. POTS is especially common in younger women and it is frequently undiagnosed or misdiagnosed as anxiety for several years before correct diagnosis.59
Limitations
Surveys have several limitations, including participant interpretation of the questions, inflexibility in answering questions, and recall bias. Furthermore, this survey focused on obtaining median times to diagnosis, rates of rediagnosis, and time to rediagnosis, meaning there is potentially a lack of depth surrounding the process in-between initial and final diagnosis. Also, surveys potentially contain skewed data; the cohort of women who volunteered for this study may be those who have had the most positive or the most adverse experiences within the medical system. Consequently, the participants may not be representative of the population of women with chronic conditions in Australia. Additionally, although the sample size exceeded statistical power calculations, is still small, and this must be recognized when considering the results presented. Finally, this study did not include male participants for a comparison. While this study contains results useful for women's health, we would recommend further study to ascertain if times to diagnosis and rates of rediagnosis are similar in men.
Conclusion
Median wait times for a diagnosis for women in Australia, when factoring in high rates of rediagnosis and time to rediagnosis, are 4 years. The literature suggests women wait longer for a diagnosis compared with men, even for female-predominant conditions. Almost half of the women in this survey reported their condition being rediagnosed and 32% of these women were first diagnosed with a MUS condition before being rediagnosed with an organic condition. In Australia, there has been no comparative work with male participants, therefore it is difficult to confirm a sex-based discrepancy and further research is required. It is important that clinicians are aware of high rediagnosis rates in female patients and understand the potential impact of systemic biases on the diagnostic process for women under their care.
Supplementary Material
Abbreviations Used
- CI
confidence interval
- EDS
Ehlers–Danlos syndrome
- IBS
irritable bowel syndrome
- ICD-10
International classification of diseases
- IQR
interquartile range
- MCAS
mast cell activation syndrome
- MCTD
mixed connective tissue disease
- ME/CFS
myalgic encephalomyelitis/chronic fatigue syndrome
- MSK
musculoskeletal
- MUS
medically unexplained syndromes
- POTS
postural orthostatic tachycardia syndrome
- RA
rheumatoid arthritis
- SE
standard error
- SLE
systemic lupus
- T2DM
type 2 diabetes mellitus
Author Disclosure Statement
No competing financial interests exist.
Funding Information
No funding was received for this article.
Supplementary Material
Cite this article as: Merone L, Tsey K, Russell D, Daltry A, Nagle C (2022) Self-reported time to diagnosis and proportions of re-diagnosis in female patients with chronic conditions in Australia: a cross sectional survey, Women's Health Reports 3:1, 749–758, DOI: 10.1089/whr.2022.0040.
References
- 1. Merone L, Tsey K, Russell D, et al. Sex and gender gaps in medicine and the androcentric history of medical research. Aust N Z J Public Health 2021;45(5):424–426; doi: 10.1111/1753-6405.13139. [DOI] [PubMed] [Google Scholar]
- 2. Usher J. Diagnosing difficult women and pathologising femininity: Gender bias in psychiatric nosology. Fem Psychol 2013;23(1):63–69; doi: 10.1177/0959353512467968. [DOI] [Google Scholar]
- 3. Katz JD, Mamyrova G, Guzhva O, et al. Gender bias in diagnosing fibromyalgia. Gender Med 2010;7(1):19–27; doi: 10.1016/j.genm.2010.01.003. [DOI] [PubMed] [Google Scholar]
- 4. Wainer Z, Carcel C, Hickey M, et al. Sex and gender in health research: Updating policy to reflect evidence. Med J Australia 2019; doi: 10.5694/mja2.50426. [DOI] [PMC free article] [PubMed] [Google Scholar]
- 5. Dresser R. Wanted Single, White Male for Medical Research. Hastings Cent Rep 1992;22(1):24–29; doi: 10.2307/3562720. [DOI] [PubMed] [Google Scholar]
- 6. Barajas-Martínez A, Ibarra-Coronado E, Sierra-Vargas MP, et al. Sex differences in the physiological network of young subjects. Front Physiol 2021;12(678507); doi: 10.3389/fphys.2021.678507. [DOI] [PMC free article] [PubMed] [Google Scholar]
- 7. Ortona E, Pierdominici M, Rider V. Sex hormones and gender differences in immune responses. Front Immunol 2019;10:1076; doi: 10.3389/fimmu.2019.01076. [DOI] [PMC free article] [PubMed] [Google Scholar]
- 8. Marrocco J. Sex in the brain: Hormones and sex differences. Dialogues Clin Neurosci 2016;18(4):373–383; doi: 10.31887/DCNS.2016.18.4/jmarrocco. [DOI] [PMC free article] [PubMed] [Google Scholar]
- 9. Vemuri R, Sylvia KE, Klein SL, et al. The microgenderome revealed: Sex differences in bidirectional interactions between the microbiota, hormones, immunity and disease. Semin Immunopathol 2018;41(2):256–275; doi: 10.1007/s00281-018-0716-7. [DOI] [PMC free article] [PubMed] [Google Scholar]
- 10. Backholer K, Peters SAE, Bots SH, et al. Sex differences in the relationship between socioeconomic status and cardiovascular disease: A systematic review and meta analysis. J Epidemiol Community Health 2017;71(6):550–557; doi: 10.1136/jech-2016-207890. [DOI] [PubMed] [Google Scholar]
- 11. van Wijk CM, Kolk AM. Sex differences in physical symptoms: The contribution of symptom perception theory. Soc Sci Med 1997;45(2):231–246; doi: 10.1016/s0277-9536(96)00340-1. [DOI] [PubMed] [Google Scholar]
- 12. Merone L, Tsey K, Russell D, et al. Representation of Women and Women's Health in Australian Medical School Course Outlines, Curriculum Requirements and Selected Core Clinical Textbooks. James Cook University; Townsville, Australia; 2022. [DOI] [PMC free article] [PubMed] [Google Scholar]
- 13. Merone L, Tsey K, Russell D, et al. Mind the gap: Reporting and analysis of sex and gender in health research in Australia, a cross-sectional study. Womens Health Rep 2022; in press. doi: 10.1089/whr.2022.0033. [DOI] [PMC free article] [PubMed] [Google Scholar]
- 14. Merone L, Tsey K, Russell D, et al. Sex inequalities in medical research: A systematic scoping review of the literature. Womens Health Rep 2021;3(1):49059; doi: 10.1089/whr.2021.0083. [DOI] [PMC free article] [PubMed] [Google Scholar]
- 15. Feldman S, Ammar W, Lo K, et al. Quantifying sex bias in clinical studies at scale with automated data extraction. JAMA Netw Open 2019;2(7):e196700; doi: 10.1001/jamanetworkopen.2019.6700. [DOI] [PMC free article] [PubMed] [Google Scholar]
- 16. Arout C, Sofuoglu M, Bastian LA, et al. Gender differences in the prevalence of fibromyalgia and concomitant medical and psychiatric disorders: A national veterans health administration study. J Womens Health (Larchmt) 2018;27(8):1035–1044; doi: 10.1089/jwh.2017.6622. [DOI] [PMC free article] [PubMed] [Google Scholar]
- 17. Faro M, Saez-Francas N, Castro-Marrero J, et al. Gender differences in chronic fatigue syndrome. Rheumatol Clin 2016;12(2):72–77; doi: 10.1016/j.reuma.2015.05.007. [DOI] [PubMed] [Google Scholar]
- 18. Sohn E. Why autoimmunity is most common in women. Nature 2021;595(7867):S51–S53. [Google Scholar]
- 19. Shaw BH, Stiles LE, Bourne K, et al. The face of postural tachycardia syndrome—Insights from a large cross-sectional online community-based survey. JIM 2019;286(4):438–448; doi: 10.1111/joim.12895. [DOI] [PMC free article] [PubMed] [Google Scholar]
- 20. National Institute of Health. Estimates of funding for various research, condition and disease categories. Research Portfolio Online Reporting Tools 2021; 2022; Available from: https://report.nih.gov/funding/categorical-spending-/ Accessed March 24, 2022.
- 21. Institute of Medicine (US). Committee on health research and the privacy of health information. In: The HIPAA Privacy Rule. (Nass SJ, Gostin LO. eds.) National Academies Press (US): Washington, DC, USA; 2009. [PubMed] [Google Scholar]
- 22. Fred H. The diagnosis of exclusion, an ongoing uncertainty. Tex Heart Inst J 2013;40(4):379–381. [PMC free article] [PubMed] [Google Scholar]
- 23. Tack M. Medically unexplained symptoms (MUS): Faults and implications. Int J Environ Res Public Health 2019;16(7):1247; doi: 10.3390/ijerph16071247. [DOI] [PMC free article] [PubMed] [Google Scholar]
- 24. Miller VM, Rice M, Schiebinger L, et al. Embedding concepts of sex and gender health differences into medical curricula. J Womens Health 2013;22(3):194–202; doi: 10.1089/jwh.2012.4193. [DOI] [PMC free article] [PubMed] [Google Scholar]
- 25. Martin GC, Kirgis J, Sid E, et al. Equitable imagery in the preclinical medical school curriculum: Findings from one medical school. Acad Med 2016;91(7):1002–1006; doi: 10.1097/ACM.0000000000001105. [DOI] [PubMed] [Google Scholar]
- 26. Parker R, Larkin T, Cockburn J. A visual analysis of gender bias in contemporary anatomy textbooks. Soc Sci Med 2017;180:106–113; doi: 10.1016/j.socscimed.2017.03.032. [DOI] [PubMed] [Google Scholar]
- 27. Dijkstra A, Verdonk P, Lagro-Janssen ALM. Gender bias in medical textbooks: Examples from coronary heart disease, depression, alcohol abuse and pharmacology. Med Educ 2008;42:1021–1028; doi: 10.1111/j.1365-2923.2008.03150.x. [DOI] [PubMed] [Google Scholar]
- 28. Mendelsohn KD, Nieman LZ, Isaacs K, et al. Sex and gender bias in anatomy and physical diagnosis textbooks. JAMA 1994;272(16):1267–1270; doi: 10.1001/jama.1994.03520160051042. [DOI] [PubMed] [Google Scholar]
- 29. Giacomini M, Rozee-Koker P, Pepitone-Arreola-Rockwell F. Gender bias in human anatomy textbook illustrations. Psychol Women Q 1986;10:413–420; doi: 10.1111/j.1471-6402.1986.tb00765.x. [DOI] [Google Scholar]
- 30. Robertson J. Waiting Time at the Emergency Department from a Gender Equity Perspective. University of Gothernburg: Institue of Medicine at the Sahlgrenska Academy: Gothenburg, Sweden; 2014. [Google Scholar]
- 31. Chen EH, Shofer F, Dean AJ, et al. Gender disparity in analgesic treatment of emergency department patients with acute abdominal pain. Acad Emerg Med 2008;15(5):414–418; doi: 10.1111/j.1553-2712.2008.00100.x. [DOI] [PubMed] [Google Scholar]
- 32. Westergaard D, Moseley P, Sorup FKH, et al. Population-wide analysis of differences in disease progression patterns in men and women. Nat Commun 2019;10:666; doi: 10.1038/s41467-019-08475-9. [DOI] [PMC free article] [PubMed] [Google Scholar]
- 33. Krassen Covan E. Chronic illness: Misunderstood, misdiagnosed and mistreated among women. Health Care Women Int 2022;43(1–2):1–4; doi: 10.1080/07399332.2022.2028470. [DOI] [PubMed] [Google Scholar]
- 34. Cox DR, Oakes D. Analysis of Survival Data. Chapman and Hall: New York, NY, USA; 1984. [Google Scholar]
- 35. World Health Organisation. International statistical classification of diseases and related health problems. 2016. Available from: https://icd.who.int/browse10/2016/en
- 36. Lim AW, Ramirez AJ, Hamilton W, et al. Delays in diagnosis of young females with symptomatic cervical cancer in England: An interview-based study. Br J Gen Pract 2014;64(627):e602–e610; doi: 10.3399/bjgp14X681757. [DOI] [PMC free article] [PubMed] [Google Scholar]
- 37. Lai HC, Kosorok MR, Laxova A, et al. Delayed diagnosis of US females with cystic fibrosis. Am J Epidemiol 2002;156(2):165–173; doi: 10.1093/aje/kwf014. [DOI] [PubMed] [Google Scholar]
- 38. Roche MM, Peizhong PW. Factors associated with a diabetes diagnosis and late diabetes diagnosis for males and females. J Clin Transl Endocrinol 2014;1(3):77–84; doi: 10.1016/j.jcte.2014.07.002. [DOI] [PMC free article] [PubMed] [Google Scholar]
- 39. Arnold LM, Crofford LJ, Mease PJ, et al. Patient perspectives on the impact of fibromyalgia. Patient Educ Counsel 2008;73(1):114–120; doi: 10.1016/j.pec.2008.06.005. [DOI] [PMC free article] [PubMed] [Google Scholar]
- 40. Walitt B, Katz. RS, Bergman, MJ, et al. Three quarters of persons in the US population reporting a clinical diagnosis of fibromyalgia do not satisfy fibromyalgia criteria: The 2012 National Health Interview Survey. PLoS One 2016;11(6):e0157235; doi: 10.1371/journal.pone.0157235. [DOI] [PMC free article] [PubMed] [Google Scholar]
- 41. Lupus Foundation of America. Lupus facts and statistics; 2016. Available from: https://www.lupus.org/resources/lupus-facts-and-statistics Accessed February 21, 2022.
- 42. Geraghty KJ, Blease C. Myalgic encephalomyelitis/chronic fatigue syndrome and biopsycosocial model: A review of patient harm and distress in the medical encounter. Disabil Rehabil 2019;41(25):3092–3102; doi: 10.1080/09638288.2018.1481149. [DOI] [PubMed] [Google Scholar]
- 43. Shire. Rare disease impact report: Insights from patients and the medical community; 2013. Available from: https://globalgenes.org/wp-content/uploads/2013/04/ShireReport-1.pdf Accessed February 21, 2022.
- 44. Sorensen J, Hetland ML. Diagnostic delay in patients with rheumatoid arthritis, psoriatic arthritis and ankylosing spondylitis: Results from the Danish nationwide DANBIO registry. Ann Rheum Dis 2015;74(3):e12; doi: 10.1136/annrheumdis-2013-204867. [DOI] [PMC free article] [PubMed] [Google Scholar]
- 45. Okten IN, Sezen BA, Gunaydin UM, et al. Factors associated with delayed diagnosis and treatment in patients with cancer. J Clin Oncol 2018;36(15); doi: 10.1200/JCO.2018.36.15. [DOI] [Google Scholar]
- 46. Din NU, Ukoumunne OC, Rubin G, et al. Age and gender variations in cancer diagnostic intervals in 15 cancers: Analysis of data from the UK Clinical Practice Research DAtalink. PLoS One 2015;10(5); doi: 10.1371/journal.pone.0127717. [DOI] [PMC free article] [PubMed] [Google Scholar]
- 47. Sarasqueta C, Zunzunegui MV, Navascues JME, et al. Gender differences in stage at diagnosis and pre operative radiotherapy in patients with rectal cancer. BMC Cancer 2020;20; doi: 10.1186/s12885-020-07195-4. [DOI] [PMC free article] [PubMed] [Google Scholar]
- 48. Lyratzopoulos G, Abel GA, McPhail S, et al. Gender inequalities in the prompt diagnosis of bladder and renal cancer after symptomatic presentation: Evidence from secondary anaylsis of an English primary care audit survey. BMJ Open 2013;3; doi: 10.1136/bmjopen-2013-002861. [DOI] [PMC free article] [PubMed] [Google Scholar]
- 49. Hudson M, Thombs B, Baron M. The Canadian Scleroderma Research Group,, Time to diagnosis in systemic sclerosis: Is sex a factor? Arth Care Res 2009;15(2):274–278; doi: 10.1002/art.24284. [DOI] [Google Scholar]
- 50. Merz CNB. The Yentl syndrome is alive and well. Eur Heart J 2011;32(11):1313–1315; doi: 10.1093/eurheartj/ehr083. [DOI] [PubMed] [Google Scholar]
- 51. Hadfield R, Mardon H, Barlow D, et al. Delay in the diagnosis of endometriosis: A survey of women from the UK and USA. Human Reprod 1996;11(4):878–880; doi: 10.1093/oxfordjournals.humrep.a019270. [DOI] [PubMed] [Google Scholar]
- 52. Agrawal SK, Chapron C, Giudice LC, et al. Clinical diagnosis of endometriosis: A call to action. Am J Obst Gynaecol 2019;220(4):354.e1–354.e12; doi: 10.1016/j.ajog.2018.12.039. [DOI] [PubMed] [Google Scholar]
- 53. Soliman AM, Fuldeore M, Snabes MC. Factors associated with time to endometriosis diagnosis in the United States. J Womens Health 2017;26(7):787–797; doi: 10.1089/jwh.2016.6003. [DOI] [PubMed] [Google Scholar]
- 54. Morgan C, Bland AR, Maker C, et al. Individuals living with lupus: Findings from the LUPUS UK members survey 2014. Lupus 2018;27(681–687); doi: 10.1177/0961203317749746. [DOI] [PMC free article] [PubMed] [Google Scholar]
- 55. Choy E, Perrot S, Leon T, et al. A patient survey of the impact of fibromyalgia and the journey to diagnosis. BMC Health Serv Res 2010;10(102); doi: 10.1186/1472-6963-10-102. [DOI] [PMC free article] [PubMed] [Google Scholar]
- 56. Mendelson C. Diagnosis: A liminal state for women living with lupus. Health Care Women Int 2009;30(5):390–407; doi: 10.1080/07399330902785158. [DOI] [PubMed] [Google Scholar]
- 57. LevinN, Mor M, Ben-Hur T. Patterns of misdiagnosis of multiple sclerosis. IMAJ 2003;5(7):489–490. [PubMed] [Google Scholar]
- 58. Lessmeier T, Gamperling D, Johnson-Liddon V, et al. Unrecognised paroxysmal supraventricular tachycardia. Arch Intern Med 1997;157(5):537–543; doi: 10.1001/archinte.1997.00440260085013. [DOI] [PubMed] [Google Scholar]
- 59. Kesserwani H. Postural orthostatic tachycardia syndrome misdiagnosed as anxiety: A case report with a review of therapy and pathophysiology. Cureus 2020;12(10); doi: 10.7759/cureus.10881. [DOI] [PMC free article] [PubMed] [Google Scholar]
Associated Data
This section collects any data citations, data availability statements, or supplementary materials included in this article.