Abstract
Highly specific molecular imaging with photoacoustics (PA) must suppress background endogenous signals while maintaining signals from target nanoagents. Magneto-motive PA was introduced to perform motion-based background suppression using a low frequency magnetic field. Previous studies show suppression based on displacement magnitude can suffer if significant physiological motion is present. This limitation can be overcome using cyclic magneto-motive PA (cmmPA), where multiple cycles of an ac magnetic field are used and the coherence of detected displacements is the retrieved information. In this paper, we show a method to enhance the magnetic response of an electromagnet specifically for cmmPA. Several magnetic frequencies were tested and a simple model is proposed to describe displacement frequency dependence. By choosing optimal parameters based on this model, we show that the technique can detect a low number of tagged cells using either US-based or PA-based displacement estimation. In addition, robustness to physiological motion is demonstrated in a moving phantom.
Keywords: photoacoustic imaging, magneto-motiv, molecular imaging, speckle tracking, ultrasound imaging
1. Introduction
Photoacoustic (PA) imaging using targeted contrast nanoagents potentially can provide spatial-temporal information on molecular events within tissue [1]. In the near-infrared band, highly absorptive agents such as gold nanoparticles enable deep detection thanks to high optical absorption at the plasmonic resonance [2]. However, the sensitivity and specificity of detection is limited by highly absorptive surrounding tissue, mainly hemoglobin. The specific targeting mechanisms can eventually lead to limited accumulation of nanoparticles, with the resulting PA signals lower or on the same order as background signals. Straightforward PA detection then leads to poor specificity and sensitivity of detection.
To address this problem, several background suppression techniques using different physical effects have been introduced. Using purely optical approaches, nanoagents can be distinguished by their photoacoustic non linearity [3–6], optical saturation mechanisms [7], by fluorescence-based approaches or by multispectral photoacoustic tomography [8]. However, all may be difficult for clinical translation because they require high fluences at the observed region, or they are confounded because of depth-dependent changes in optical scattering at different wavelengths, or they need a high-power tunable laser.
Non-optical background suppression methods not limited in these ways offer a competitive alternative. Magneto-motive PA imaging (mmPA) [9] and magneto-motive ultrasound (mmUS) [10] were introduced to distinguish targeted areas based on motion of super-paramagnetic nanoparticles induced by an external electromagnet. Indeed, speckle tracking in both PA and US (PAUS) imaging can detect displacements at the micron-scale level, which is relevant given the amplitude of nanoparticle displacements.
Previous mmPA or mmUS studies relied on the magnitude of displacements induced by a single magnetic pulse to provide a mask that would be applied to the initial US or PA image resulting in the final image. In vivo studies demonstrated the feasibility of this approach by setting a noise level of 5 μm and by performing image acquisition at the optimal time of the breathing cycle, where physiological motion is minimized [10]. Thus, the display frame rate is potentially reduced for real-time operation. Also, small magnetic displacements are difficult to distinguish from physiological motion since magnetic displacements can have similar or smaller amplitudes compared to such motion.
In a previous publication [11], we presented a new derivative of mmPA using multiple-cycle magnetic excitations. This method, called cyclic-mmPA (cmmPA), can generate a mask independent of displacement amplitude, ranging widely from 0.1 to 400 μm depending on particle concentration. The threshold to create the mask is a number between 0 and 1 based on the degree of coherence between induced displacements and the applied magnetic field. cmmPA was shown to produce higher sensitivity than previous techniques. Here we discuss this approach in more detail, showing how the magnetic excitation can be optimized for efficient cmmPA imaging even for a small number of targeted particles bound to a limited number of cells.
After introducing the principle of cmmPA implemented using PA displacement (PAD) or US displacement (USD) measurements obtained from 2D imaging with a linear ultrasound array, we present a coded excitation approach to improve higher frequency excitations at a few tens of Hertz. Then, cmmPA will be compared in the same situations with PAD or USD to understand the relative advantages of both speckle tracking methods. Peak-to-peak displacement and image quality in terms of contrast-to-noise ratio (CNR) between the targeted region and background using different excitation cycle numbers and frequencies are derived and compared. Finally, the motion robustness of our approach will be illustrated in an in vitro experiment using mmUS with a phantom subjected to significant translational motion.
2. Material and methods
2.1. cmmPA principle
To illustrate the algorithm, a phantom was prepared with three cylindrical inclusions (2 mm diameter) made of polypyrrole (Ppy) (non-magnetic) [12], hybrid Ppy-coated magnetic iron oxide 50 nm nanoparticles (MNP-Ppy) [11], and bare iron oxide 50 nm nanoparticles (MNP). While a multiple cycle magnetic excitation is applied to the region, a series of 400 images (PA or US) are recorded at a frame rate enabling sufficient sampling of magneto-motive motion. The PA image of the medium is captured as shown in figure 1(a). A speckle tracking algorithm [13, 14] is applied to these 400 frames to recover the magnetic displacement over time. In figure 1(b), the black curve from one representative pixel indicates the absolute displacements (obtained by accumulating the (PA or US) frame-to-frame displacements) after applying a low-pass filter to remove noise. A high-pass filter removing low-frequency physiological motions or other interferences is then applied to these curves to obtain the blue curve, which contains bipolar pulses with given peak-to-peak amplitudes (map shown in figure 1(c)). The time-coherence between the displacements and the magnetic excitation is then analyzed by cross-correlating with a three-state signal derived from the magnetic square excitation (0, +1, −1 … +1, −1, 0).
Figure 1.
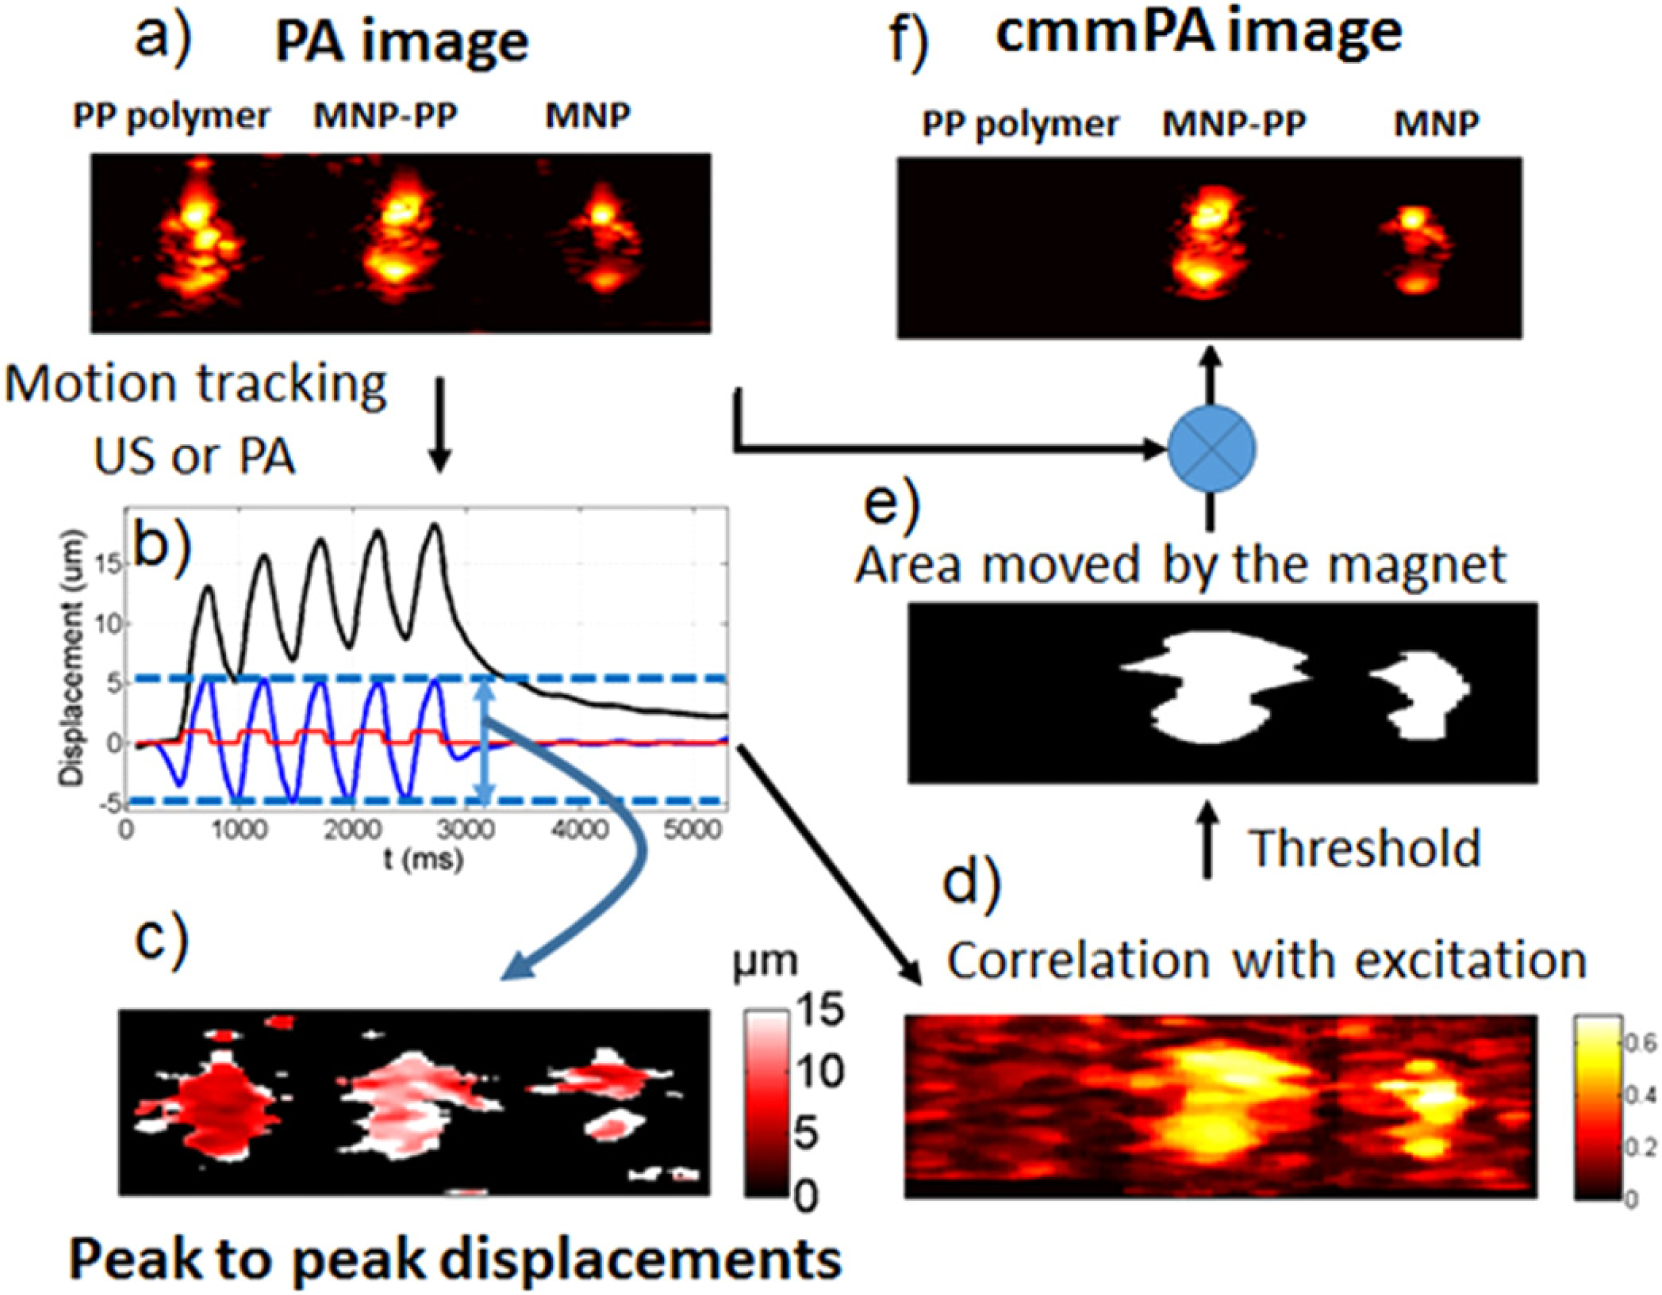
Principle of cmmPA and correlation with excitation masking. (a) PA image of three inclusions in a PVA gel (left to right: polypyrrole(Ppy), MNP-Ppy, MNP). (b) Resulting motion determined from US images over time for a 2 Hz excitation. Black: low-pass filtered displacements. Blue: band-pass filtered displacements. Red: magnetic excitation. (c) Peak to peak displacements. (d) Correlation with excitation map. (e) Threshold mask for a correlation value higher than 0.5. (f) Final cmmPA image.
The normalized cross-correlation at each point of the image generates the correlation with excitation map (CEM, between 0 and 1, see figure 1(d)). Moving areas appear to have a CEM value higher than 0.3. Generally, a CEM threshold of 0.5 can be used to create an appropriate binary mask (see figure 1(e)) that denotes the presence of magnetic nanoparticles. This initial PA image is then multiplied by this mask to obtain the cmmPA image (see figure 1(f)). Note that background suppression doesn’t use information on displacement magnitude. The CEM value is easily set (close to 0.5) in most scenarios, even if the displacement magnitude can vary by several orders of magnitude depending on experimental conditions.
2.2. In vitro setup
Figure 2 illustrates the experimental setup for in vitro studies. A 532 nm pumped wavelength tunable optical parametric oscillator (OPO) laser (Surelite OPO plus, Continuum, Santa Clara, CA, USA) delivered 800 nm laser pulses, with a 10 ns duration at a 20 Hz repetition rate, to generate PA signals. An 800 nm wavelength was used for these studies to match the optical absorption properties of the PP-based nanoparticle absorbers. An optical fiber was coupled to the laser and a set of lenses helped adjust the beam diameter to around 6 mm. A 256-element linear array (AT8L12–5 50 mm, Broadsound, Hsinchu, Taiwan) was interfaced with an ultrasound imaging system (V1, 128TX/64RX, Verasonics, Redmond, WA, USA). The optical fluence was adjusted with absorptive ND filters (Thorlabs, Newton, NJ, USA). A FPGA module driven by the external clock of the US scanner was used to drive the flash lamp and the Q-switch of the laser and PA data acquisition. Using this approach, jitter was minimized to enable accurate speckle tracking. A coil (Ledex, USA) coupled to a conical soft-iron core was powered by a current amplifier (Quanser, Canada) driven by a function generator (AFG-3252, Tektronix, OR, USA). The function generator was programmable from Matlab to allow arbitrary signal emissions. The magnetic field could reach 0.7 T at the surface of the core tip (2 mm diameter). The details of the imaging target are described in section 2.4.
Figure 2.
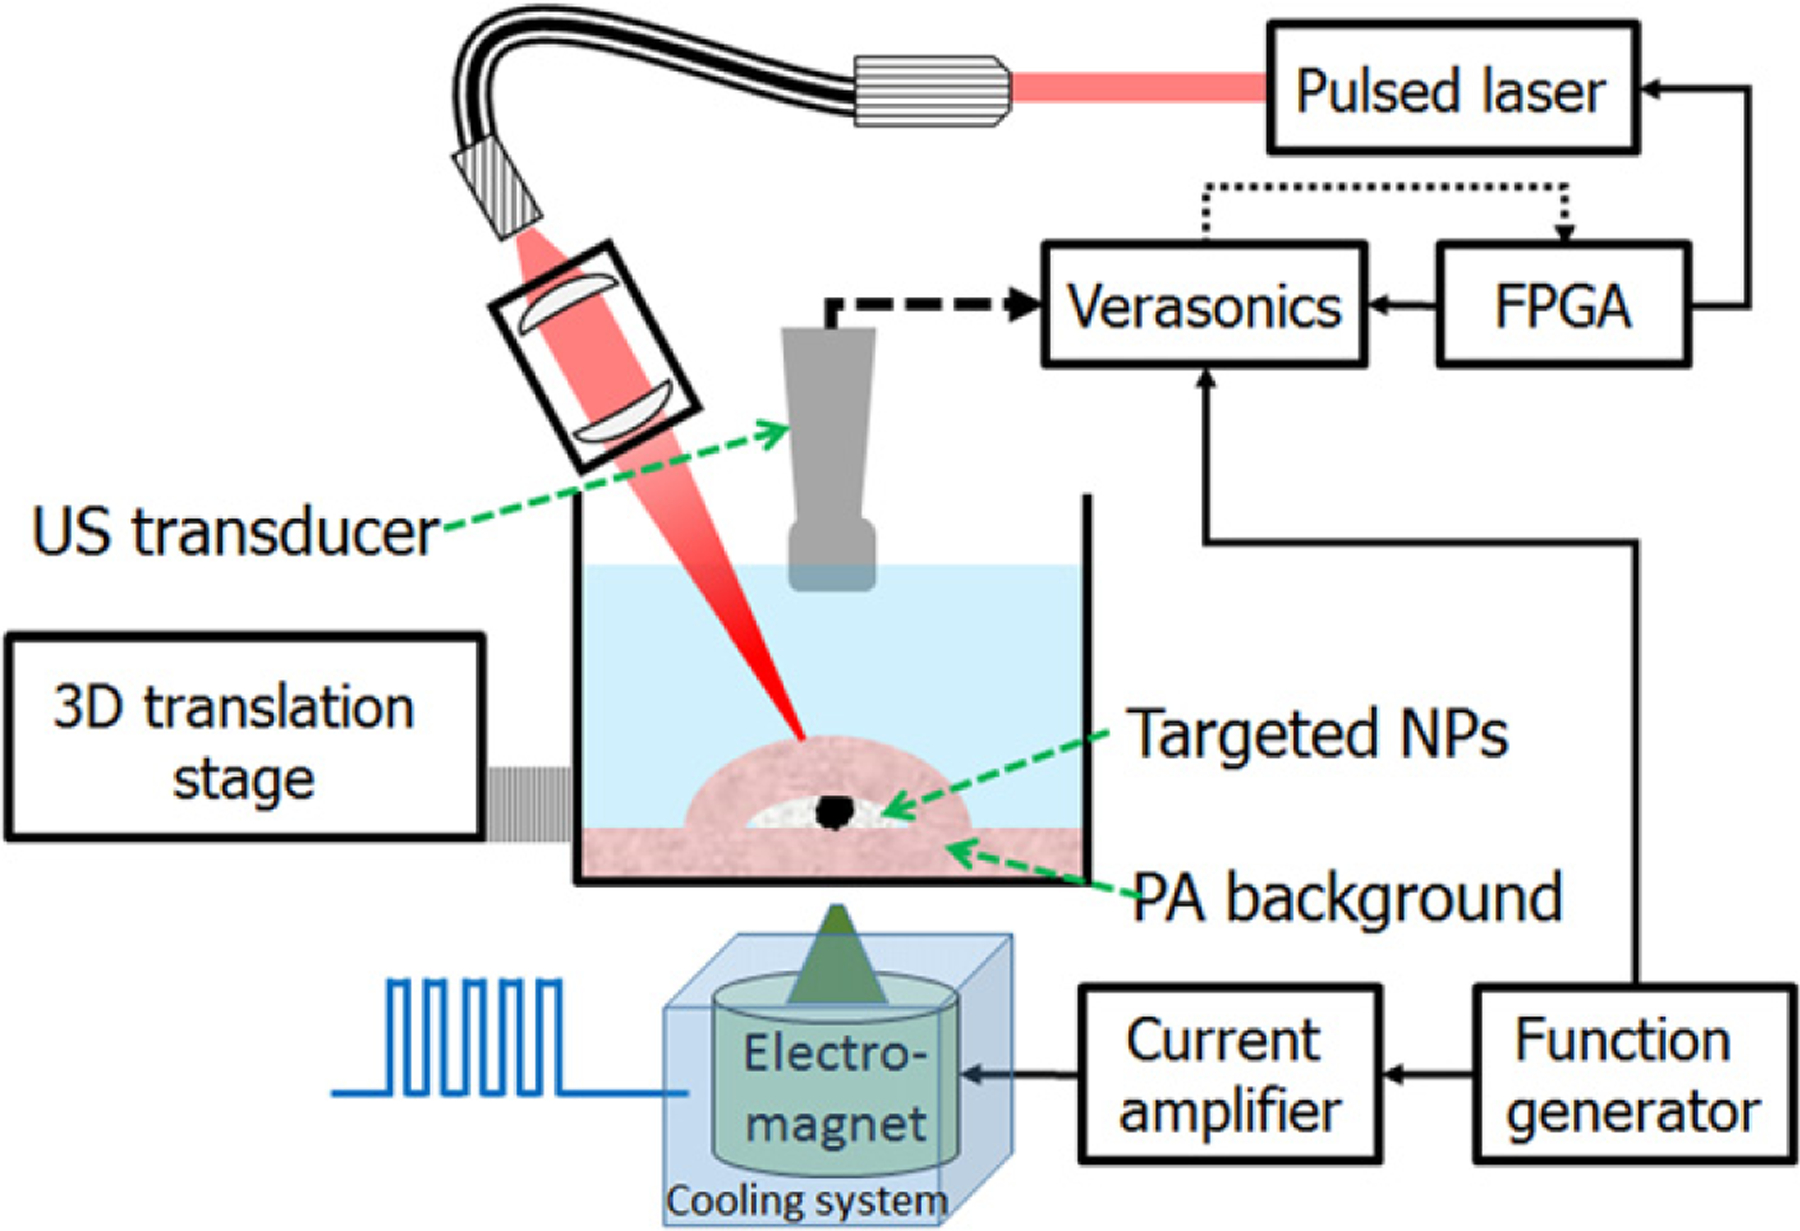
Setup for in vitro cmmPA imaging. Laser pulses are focused to a beam of 6 mm around the region of interest. An FPGA module ensures precise timing between lasing and each image recorded by the programmable scanner (Verasonics). A function generator both starts the imaging sequence and the magnetic burst. A cooling system ensures no heat is transferred from the magnet to the sample.
2.3. Coded excitation
The high permeability core material of the magnet increases the net magnetic field for a given current passing through the electromagnet. However, the material’s coercivity causes energy loss when the magnetization is reversed or just changed. As cmmPA relies on multiple magnetic pulses, an optimal drive must be developed at each excitation frequency to ensure full magnetic field relaxation allowing targeted tissue relaxation and a high resulting peak-to-peak displacement for each cycle. In figure 3(a), the magnetic field response to a 10 Hz square wave (in blue) has two different time constants for both rise and fall. Between each high level, the medium is then submitted to a residual magnetic field which limits mechanical relaxation of the targeted tissue, reducing the amplitude of peak-to-peak displacements and the coherence between induced magnetic motion and the excited pulses.
Figure 3.
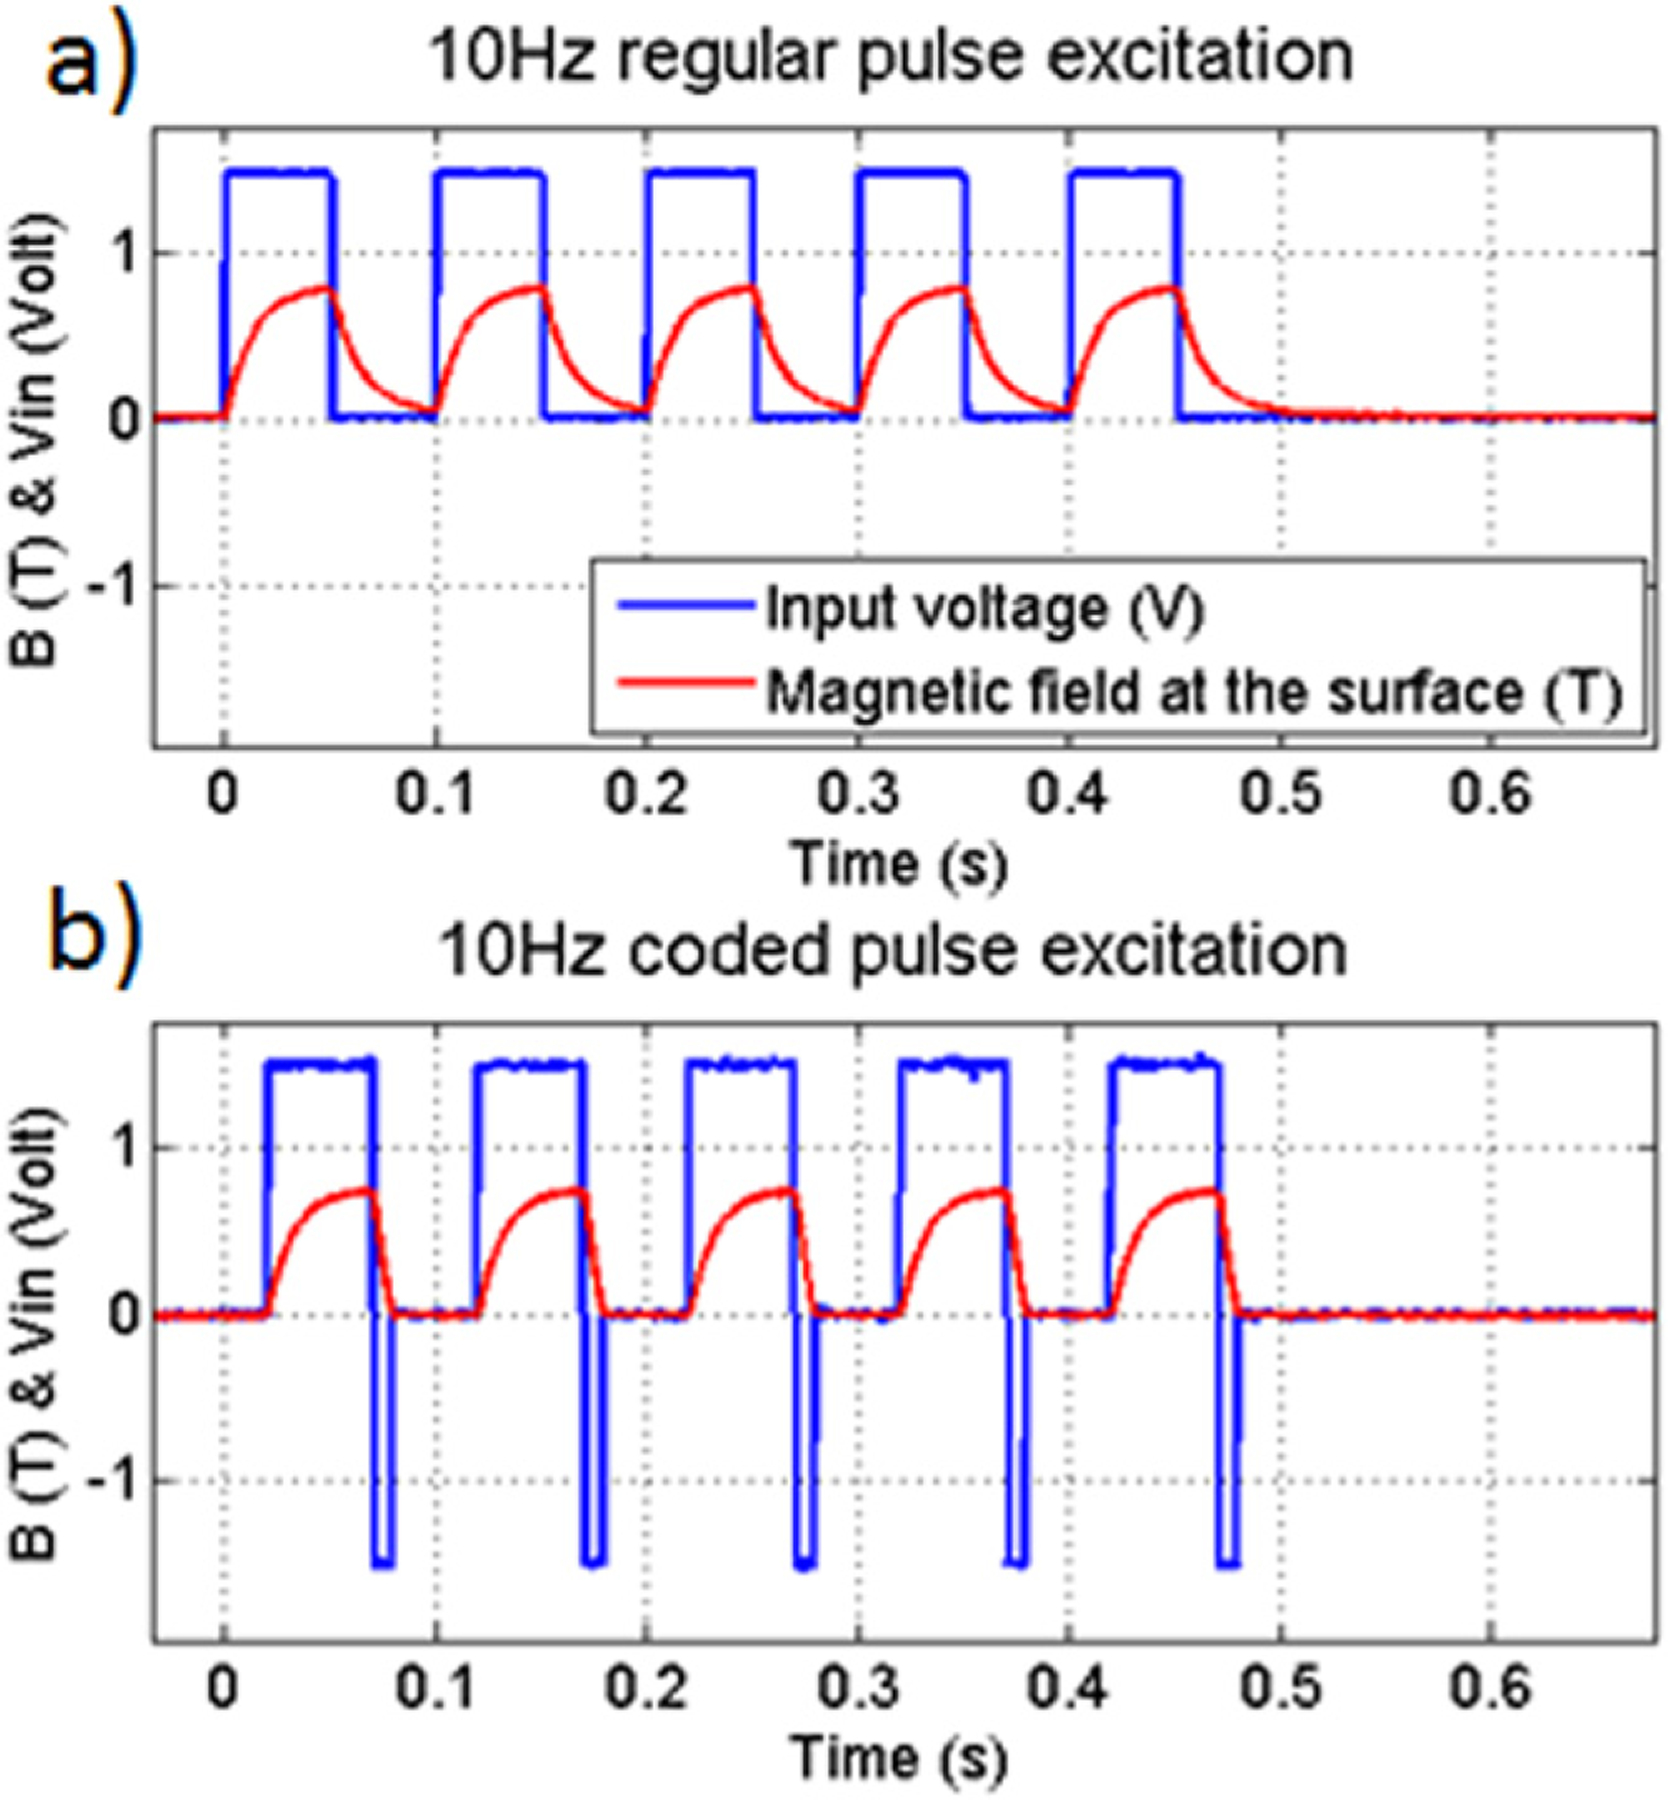
Input voltage and magnetic response at the surface of the core of the electromagnet using: (a) regular pulse sequence. (b) Coded excitation sequence.
If the voltage is reversed during a short time (called ‘overshot’) as shown in figure 3(b), the magnetic relaxation time is shortened. The overshot can be optimized experimentally by ensuring that the magnetic field is zero at the end of each overshot. Using this enhanced relaxation technique, peak-to-peak displacements in a gelatin phantom with an inclusion of magnetic particles (15 μm diameter—chosen to produce relatively large displacements for these model studies) can be increased by 12% at 10 Hz, 15% at 20 Hz and 38% at 40 Hz. Without overshot, the peak-to-peak displacement decreases over the 5 cycles. This can be due to the presence of a low frequency drift in the integrated displacement leading to non linear elasticity phenomenon. With overshot, this drift is minimized and the peak-to-peak displacement gain over 5 cycles increases by 17% at 10 Hz, 23% at 20 Hz and 73% at 40 Hz.
For a series of frequencies from 0.5 to 250 Hz, the optimal overshot was determined empirically. The overshot time normalized by the half period of the magnetic excitation is shown in figure 4(a). Given that there is no modification of the rising time constant, the magnetic field peak value increasingly lowers with frequency. Moreover, applying force during shorter times also decreases the peak displacement of MNPs. An experiment to image MNP–Ppy tagged cells was conducted to find the relation between peak displacement and the excitation frequency ranging from 0.5 to 30 Hz.
Figure 4.
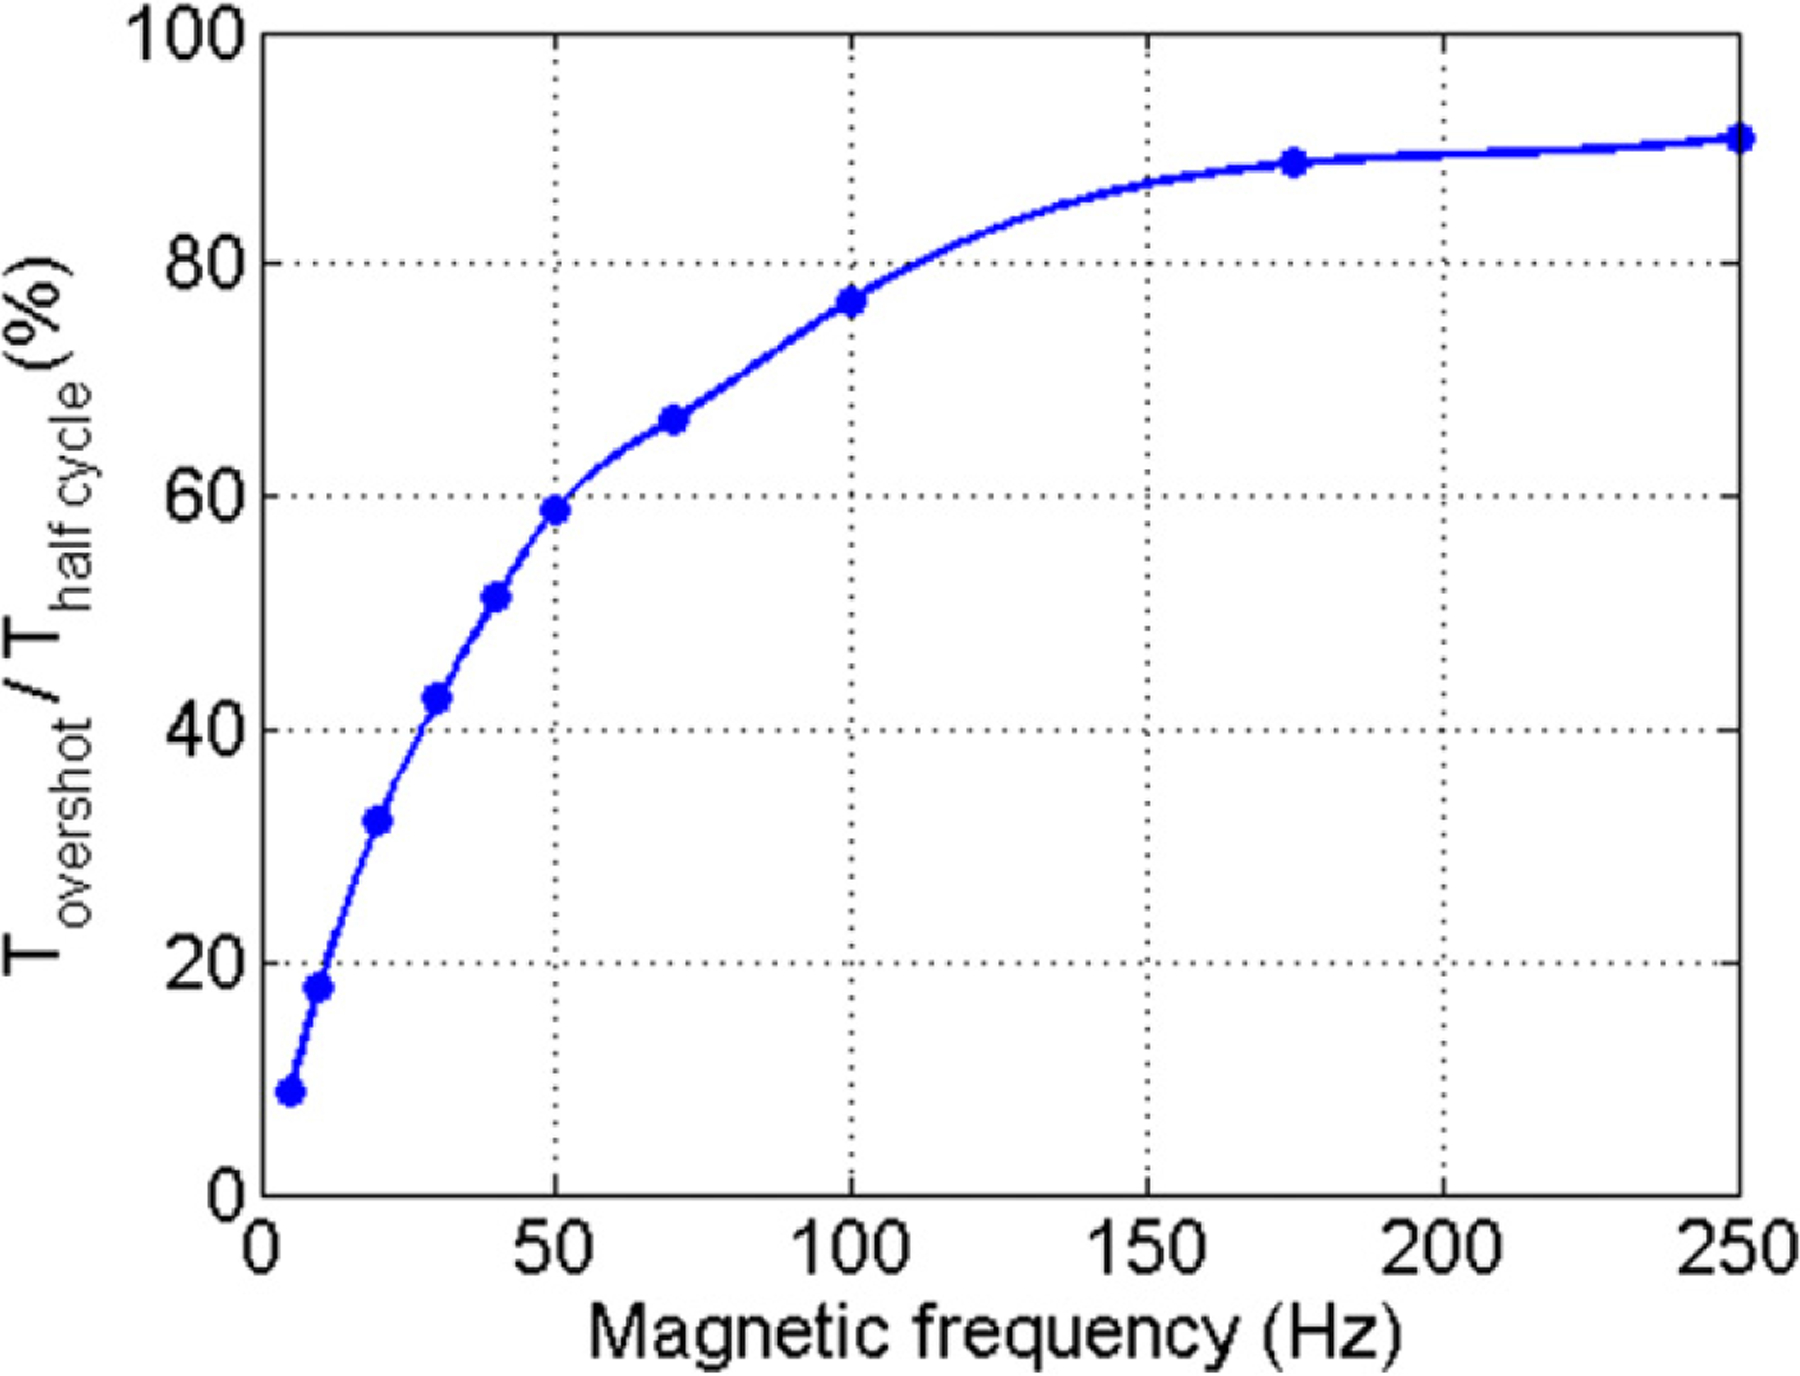
Optimal ratio between the negative pulse duration and the period of the initial square wave. This value maximizes the relaxation speed without inducing a negative magnetic field.
2.4. Phantom preparation
A human cervical cancer cell line (HeLa) has been used in this study to test whether enhanced cmmPA methods could detect a small number of tagged cells within phantoms exhibiting large background signals. Absorptive magnetic nanoparticles (polypyrrole coated iron oxide [11, 12]) were targeted in vitro to Hela cells with folic acid (0.5 nM) as targeting ligands. Around 0.72 × 10⁶ nanoparticles were loaded into single cells (see figure 5). The cells were then embedded in polyvinyl alcohol (PVA, 8%).
Figure 5.
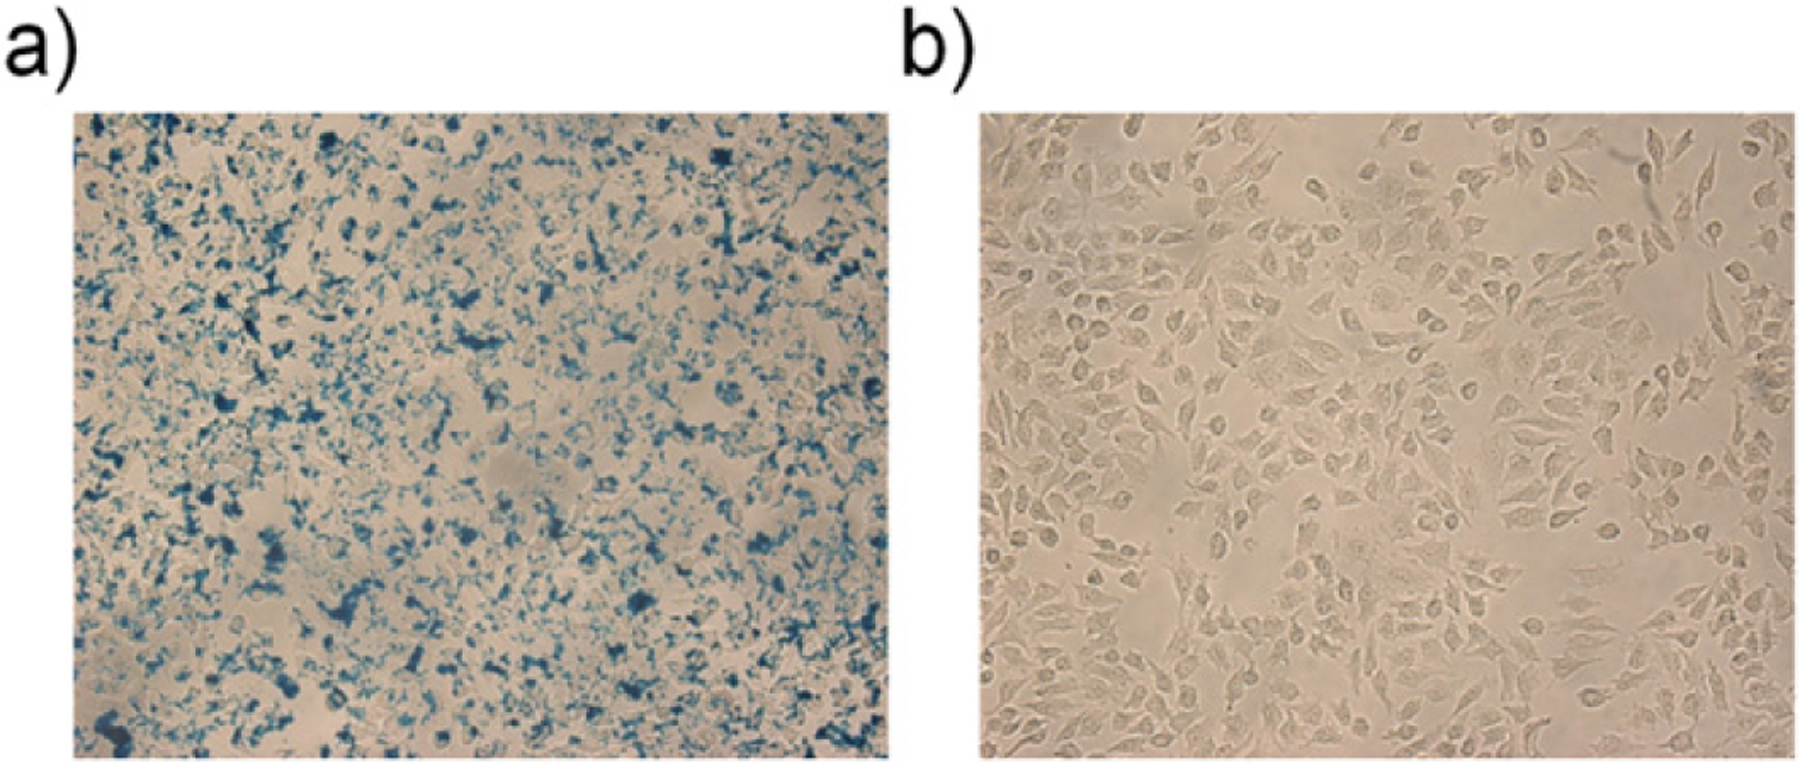
Bright field micrographs of HeLa cells (a) treated with 0.5 nM MNP–Ppy nanoparticles and (b) without treatment. Prussian blue was used for staining.
Results presented in figure 6 explore the relationship between peak displacement and frequency for MNP-tagged cells embedded in PVA. For figures 8 and 9, these PVA inclusions have been sandwiched between two liver slices of 5 mm thickness, mimicking biological tissue. The cell number was estimated as 500 and 10 000 for figures 8 and 9, respectively. For figure 10, iron oxide 10 μm microparticles (BioMag, Polysciences, PA, USA—again, chosen to produce relatively large displacements for these model studies) have been used in a 8% gelatin phantom to test the motion robustness of cmmPA for artificial displacements mimicking typical physiological motion encountered in vivo [11].
Figure 6.
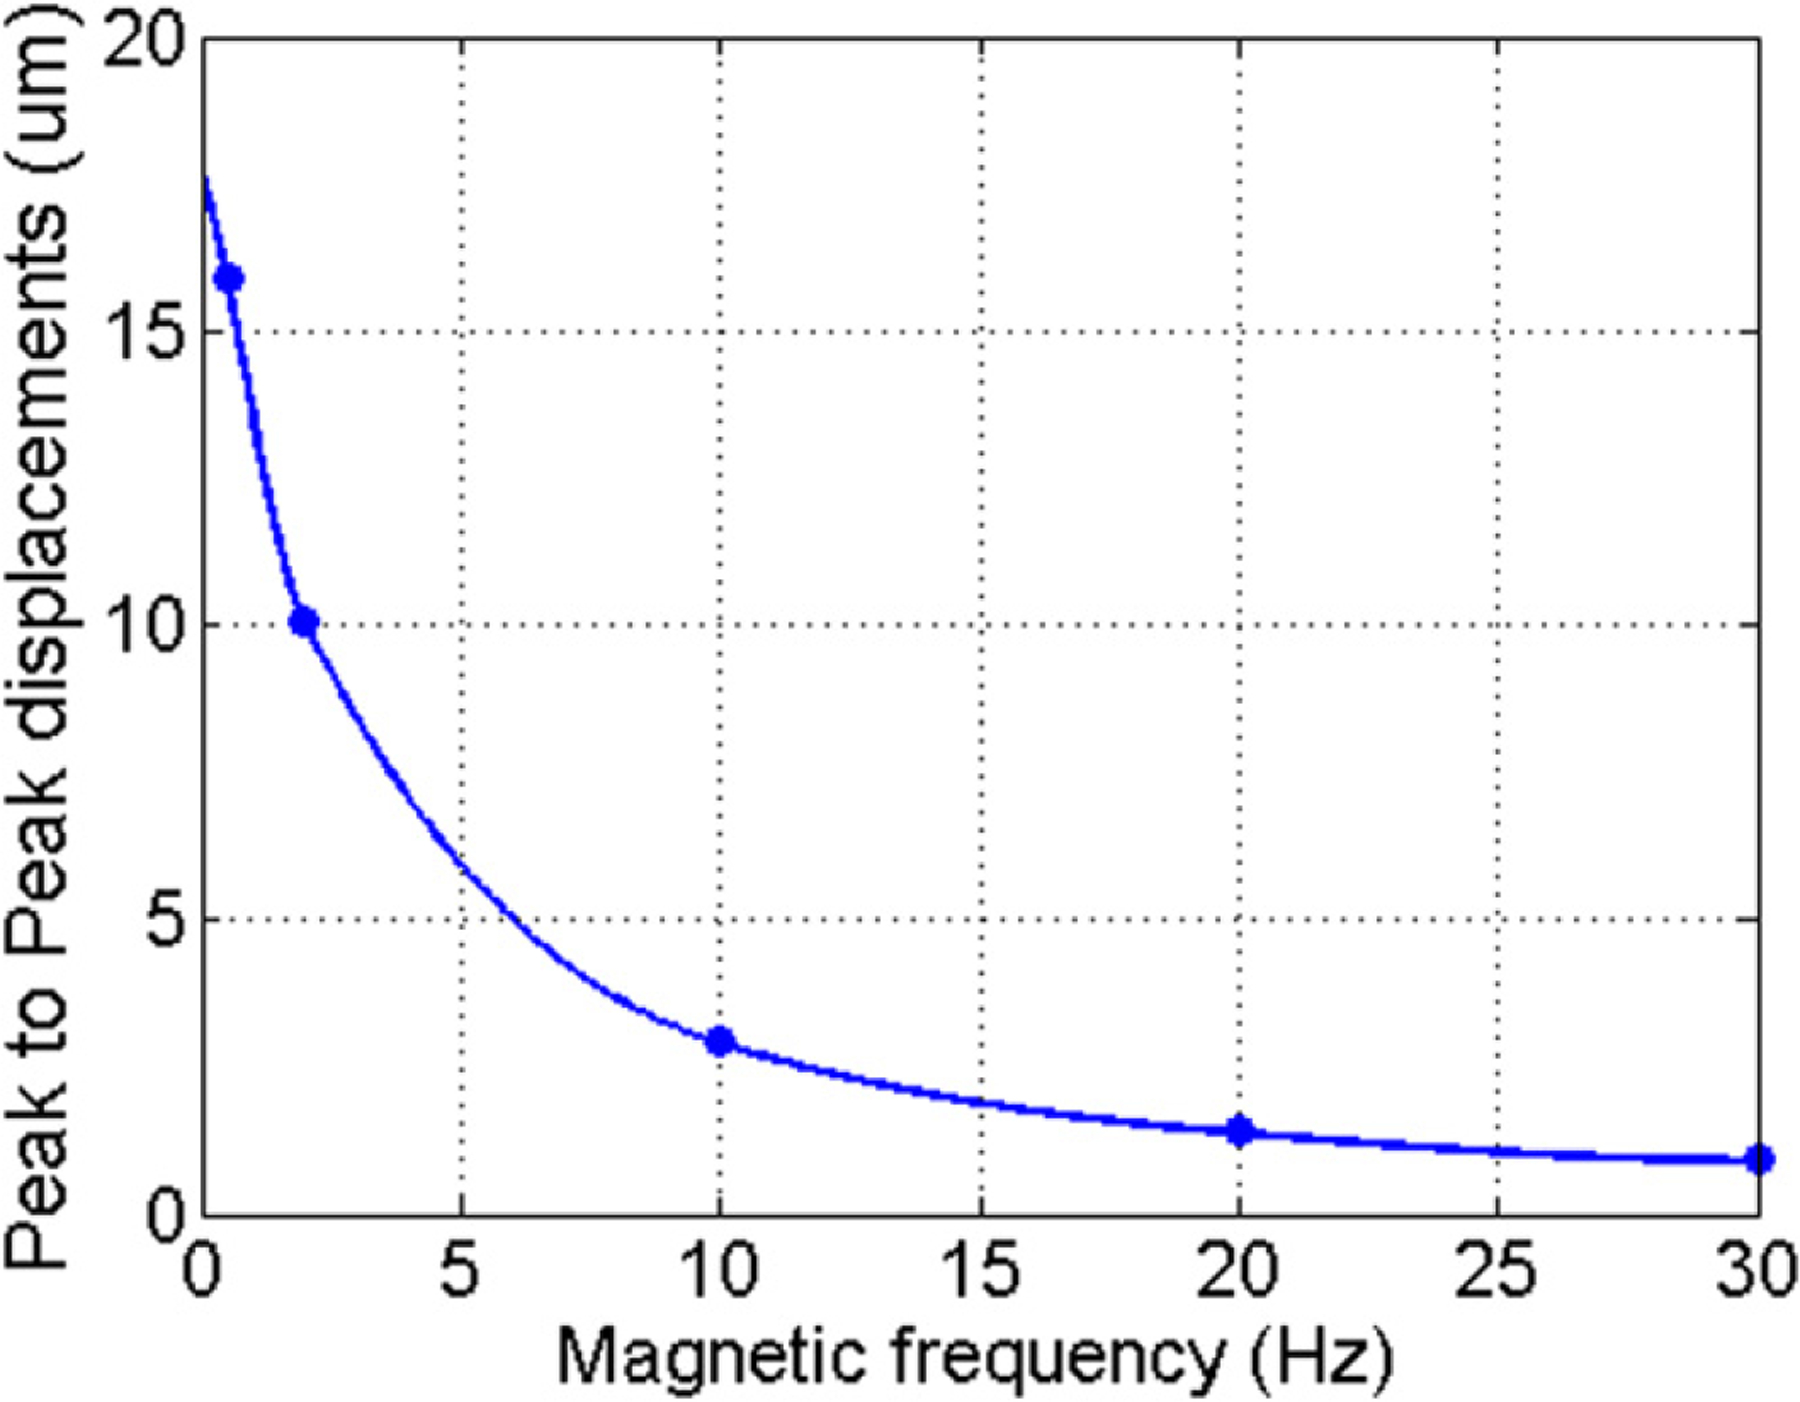
Evolution with frequency of the peak-to-peak band-pass filtered displacements for an inclusion of MNP-ppy.
Figure 8.
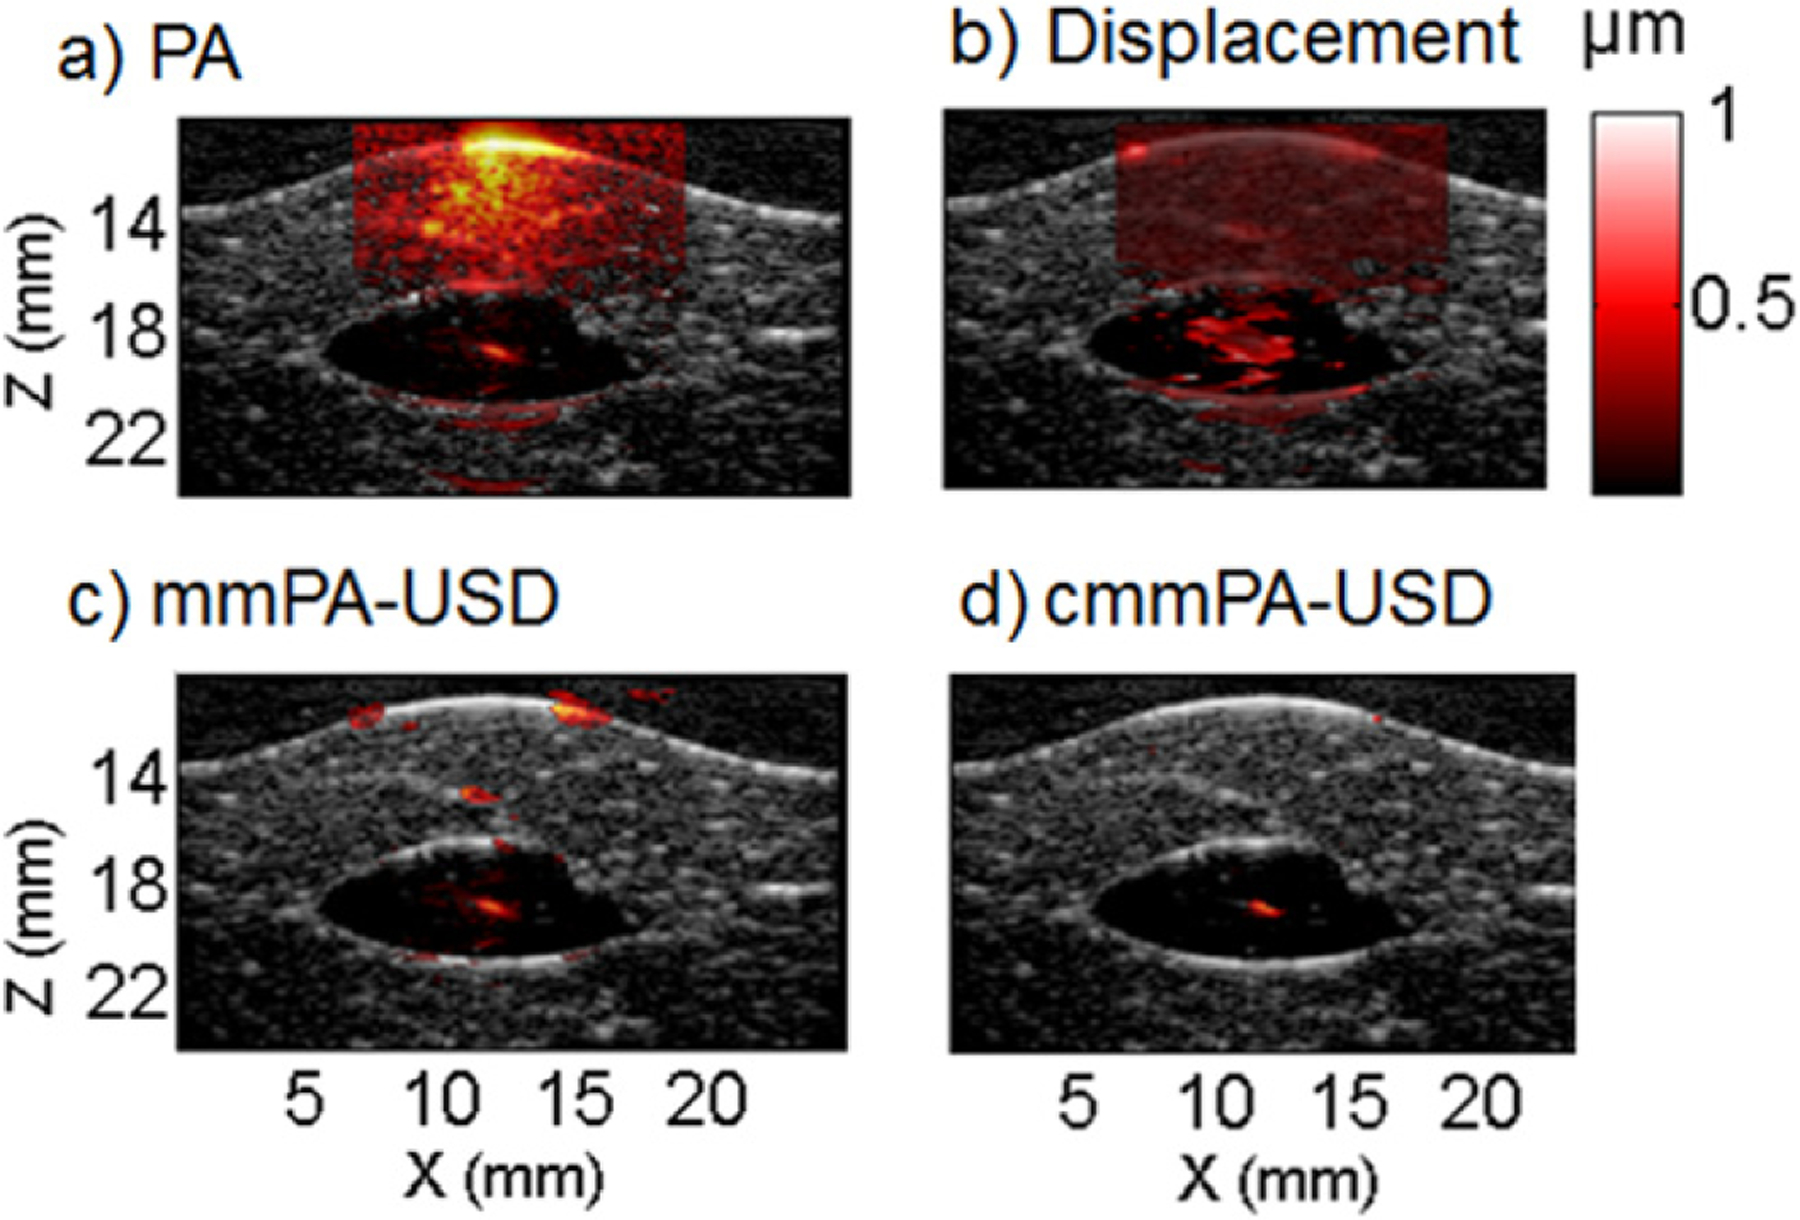
Liver phantom with an inclusion of 500 tagged HeLa cells fixed in PVA. (a) Initial PA image. (b) Peak to peak displacements map. (c) mmPA image using a mmUS mask with a displacement threshold of 0.4 μm. (d) cmmPA image using a mmUS mask based on a correlation with excitation threshold of 0.5.
Figure 9.
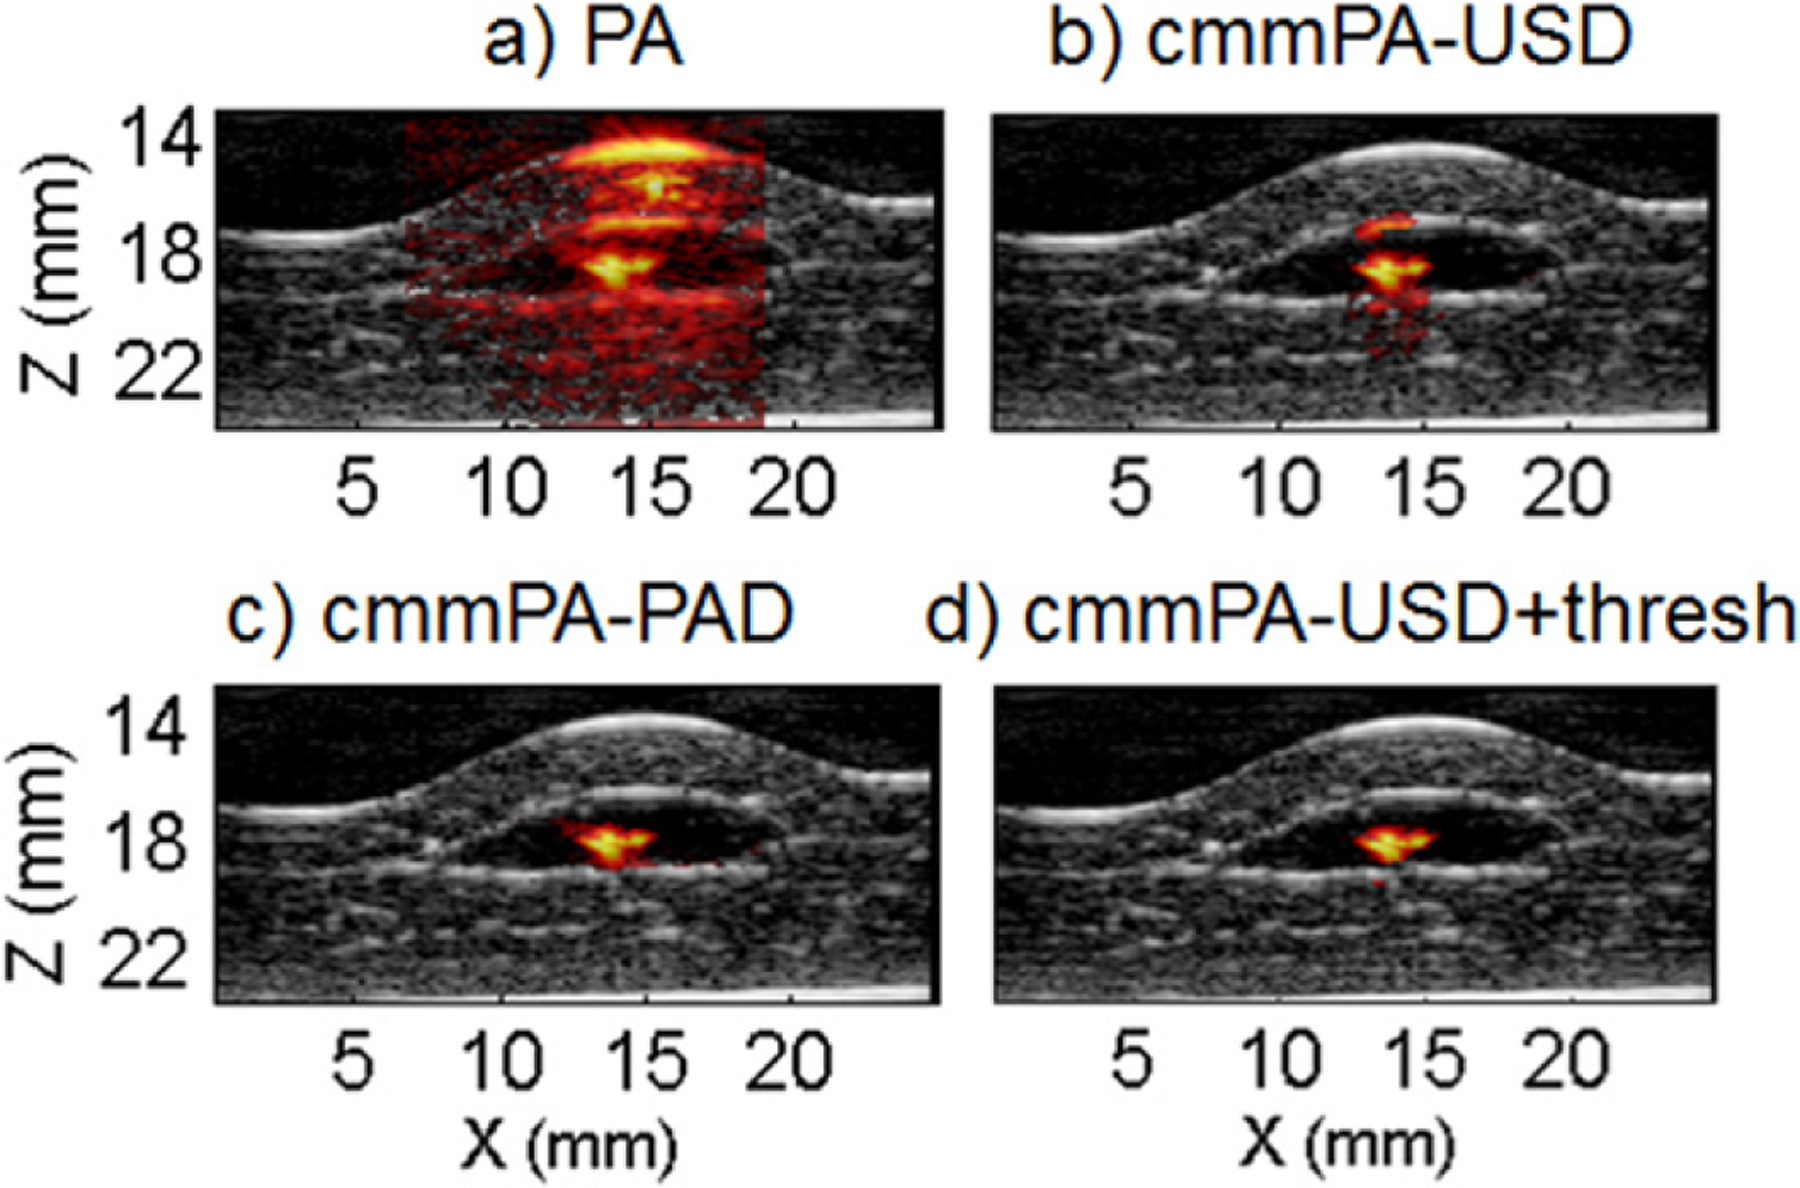
Liver phantom with a cell inclusion of 10 000 cells. (a) Initial PA image. (b) cmmPA-USD using 5 cycles at 2 Hz. (c) cmmPA-PAD image using 5 cycles at 0.5 Hz. (d) Same as (b) with an additional threshold on peak-to-peak displacements (3 μm).
Figure 10.
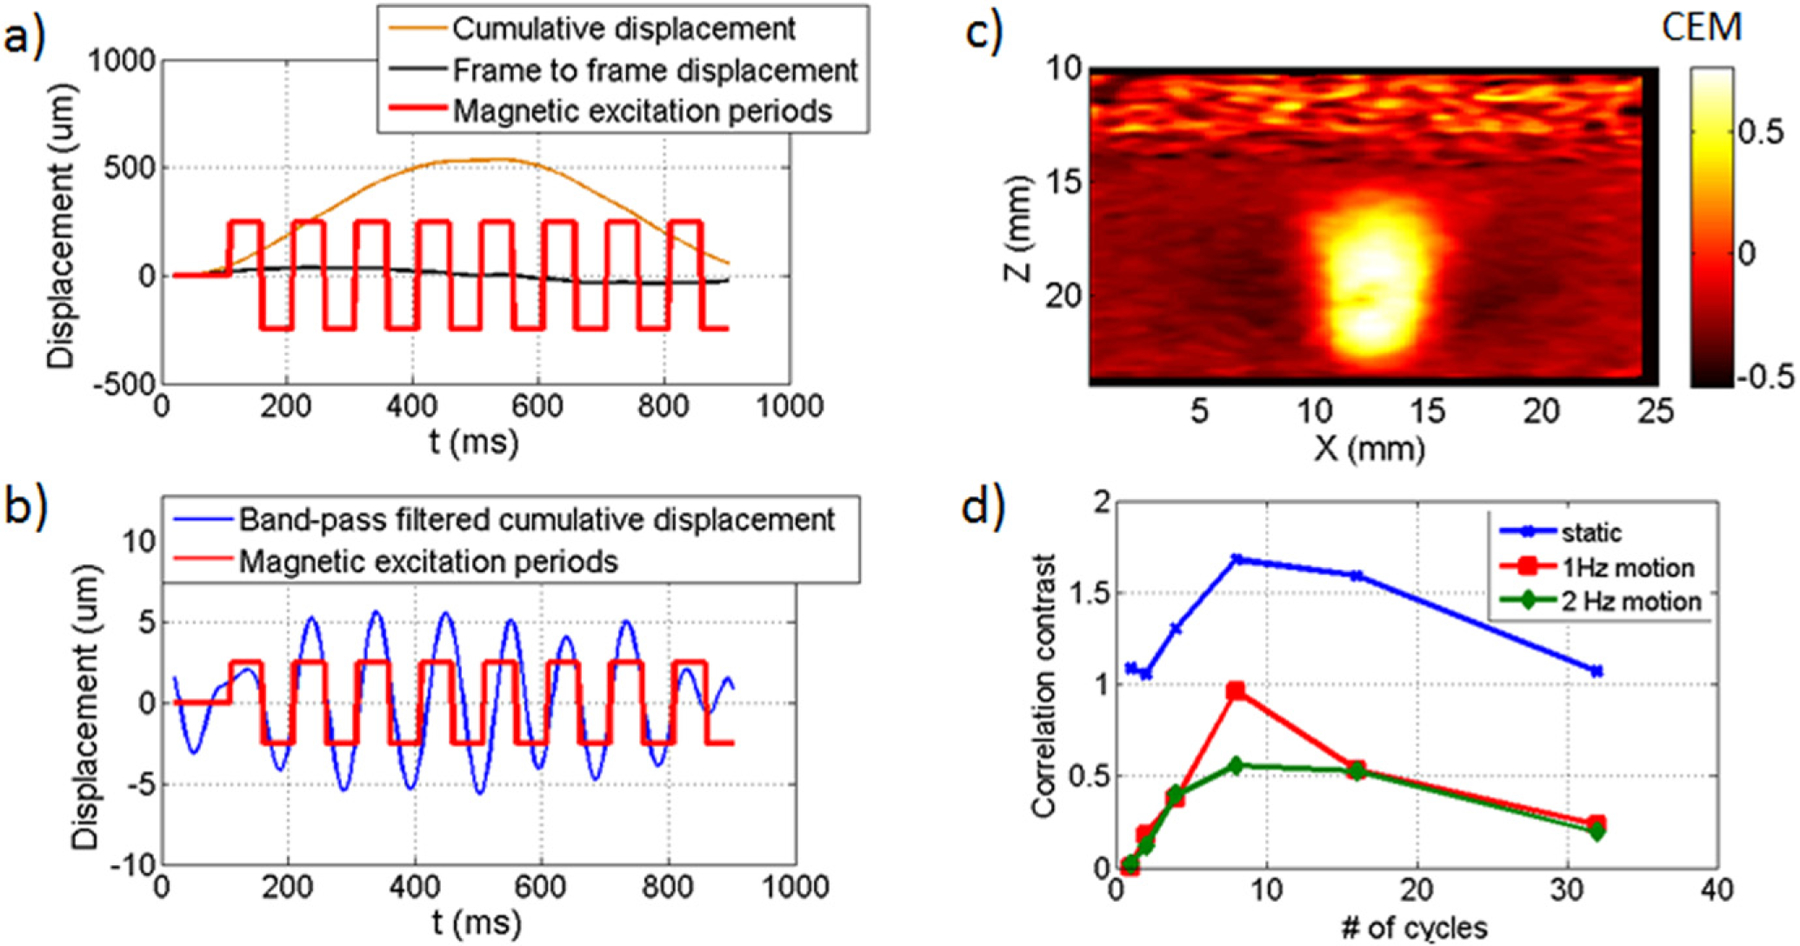
In vitro motion robustness results. (a)–(c) Results using 8 cycles at 10 Hz with a 1 Hz background motion of 500 μm amplitude. (a) Displacements before high-pass filtering: cumulative displacements obtained from accumulating frame to frame displacements. (b) Bandpass filtered displacement superimposed on the magnetic cycles. (c) CEM map clearly identifies the inclusion of iron oxide microparticles. (d) Correlation contrast function versus number of magnetic cycles for static case (blue dots, no background motion) and 1 Hz motion (red squares, 500 μm) and 2 Hz (green diamonds, 100 μm).
3. Results
3.1. Peak displacement versus excitation frequency
In figure 6, peak-to-peak displacements drastically decrease with frequency from 0.5 to 30 Hz. Thus, depending on the chosen frequency, displacements in cmmPA can be small and the technique must be performed using high signal to noise ratio (SNR) signals with excellent system synchrony (i.e., negligible jitter).
3.2. Effect of the number of magnetic cycles
Using a single data set, the effect of the number of cycles can be evaluated. The CEM map is calculated for different truncations of the magnetic excitation. For each number of cycles, the contrast to noise ratio (, std: standard deviation calculated in the tagged and background regions) between targeted cells and the background was evaluated for USD with a magnetic excitation at 10 Hz (frame rate of 400 Hz) and for PAD with a magnetic excitation at 0.5 Hz (frame rate of 20 Hz), as shown in figure 7. In both situations, the CNR increases with the number of cycles thanks to an increase in phase information. Clearly, USD has better CNR because US signals generally have a higher SNR than PA signals.
Figure 7.
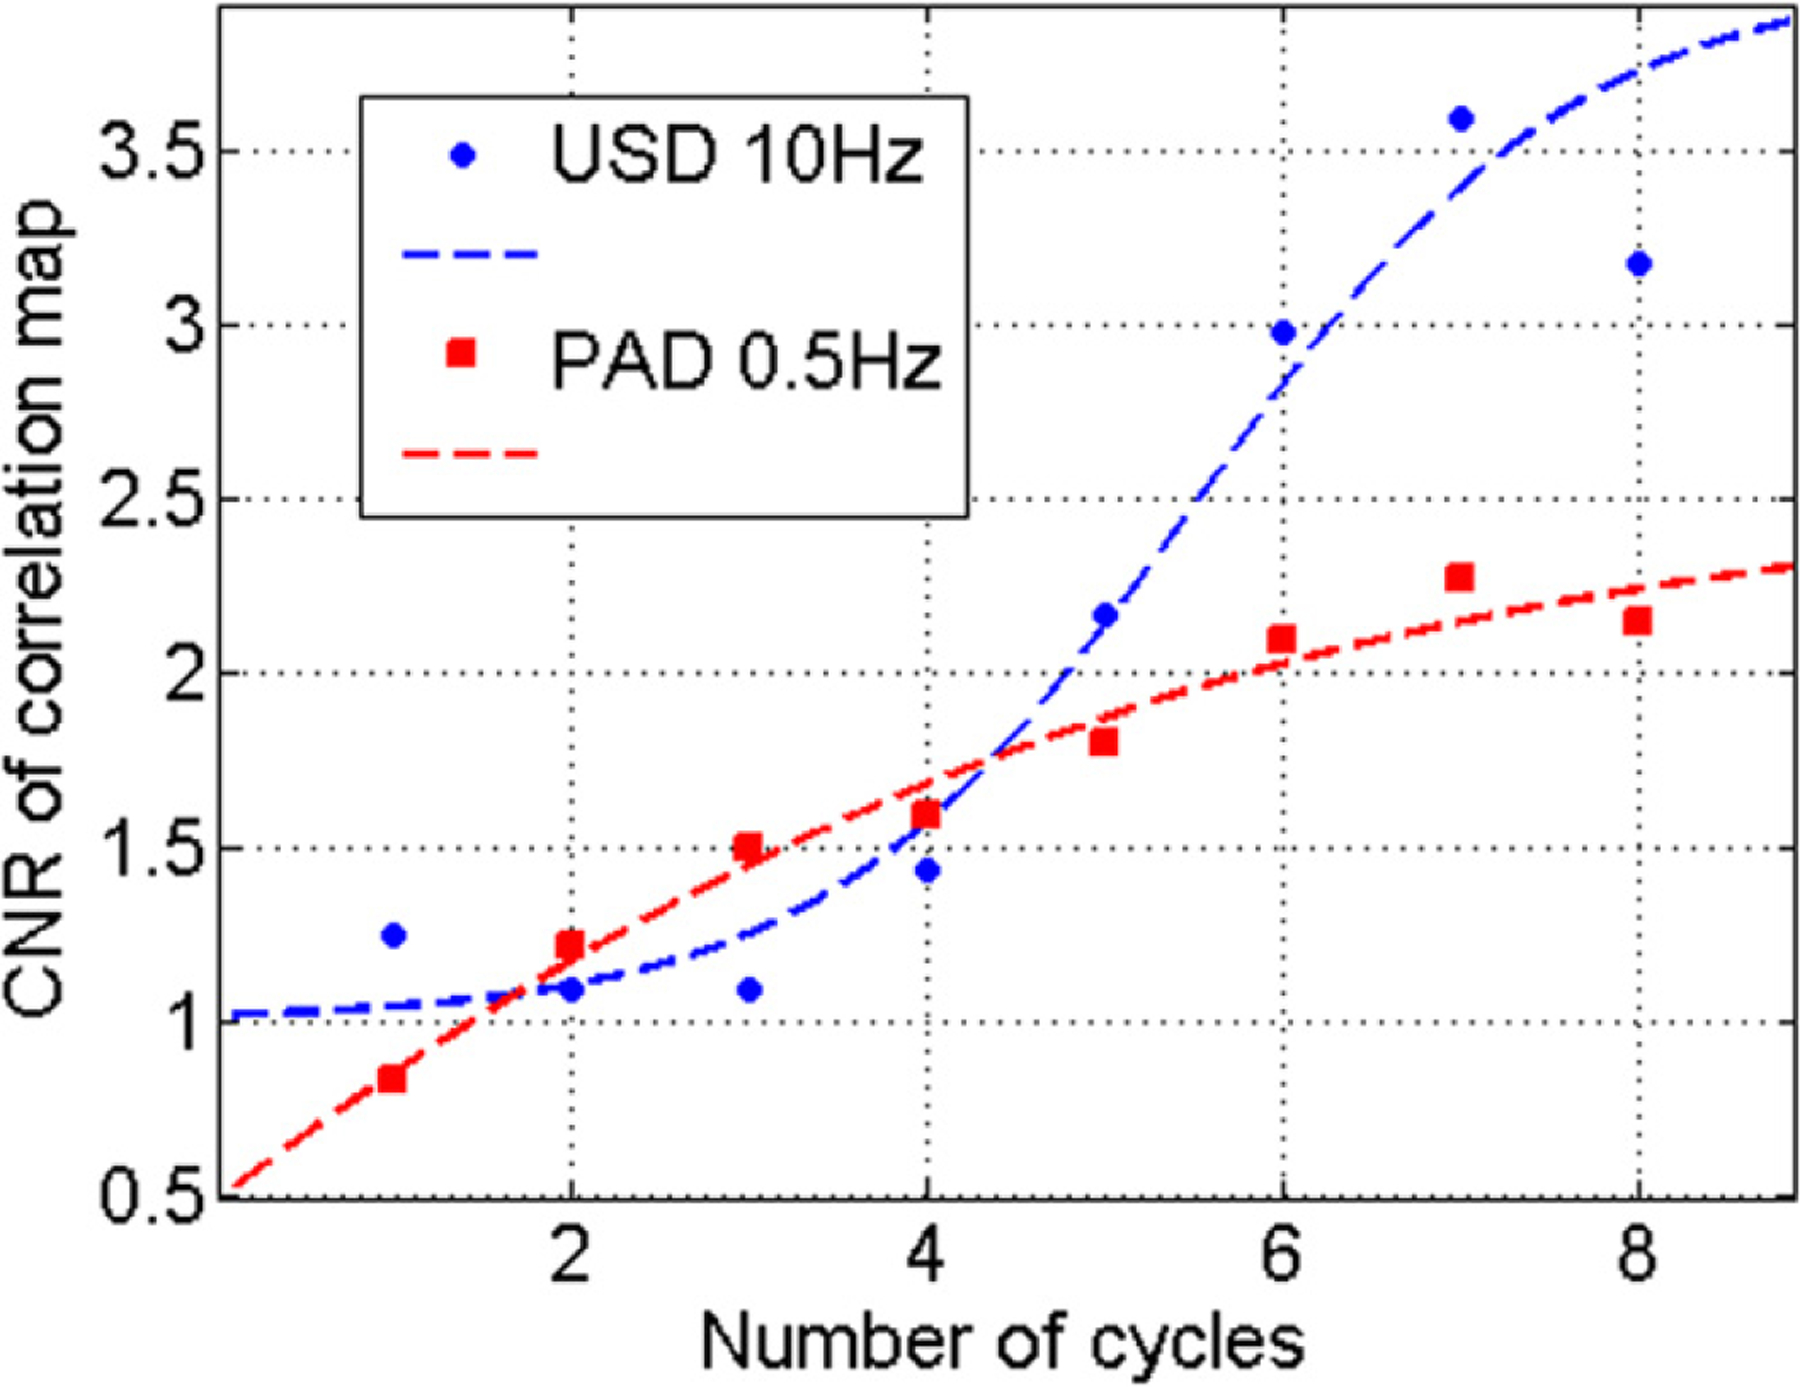
Liver phantom—PVA experiment—CNR evolution of the correlation with excitation map: (blue) 5000 tumor cell inclusion using USD, from 1 to 8 cycles at 10 Hz; (red) 5000 tumor cell inclusion using PAD, from 1 to 8 cycles at 0.5 Hz.
3.3. Sensitivity
Figure 8(a) shows the resulting PA image (hot colormap, 60 dB dynamic range) overlaid on the US image (grayscale, 60 dB dynamic range) of MNP-Ppy tagged HeLa cells between porcine liver slices. The highly optically absorptive liver tissue, due to high hemoglobin concentration, creates a high amplitude PA signal at the surface that gradually decreases with depth. The targeted area can still be seen as a red spot in the center of the dark area, at a depth of 18 mm. In typical mmPA imaging, a displacement threshold was predetermined according to the displacement map (figure 8(b)) to separate the targeted region from the background. An mmPA image was formed using 400 US frames and a threshold on the peak-to-peak displacement of 0.4 μm was used to obtain the result shown in figure 8(c). The targeted area is recovered but additional noise is present within the liver tissue. With a higher threshold, the targeted area is not fully recovered. A smaller threshold induced more secondary signals from the liver background (i.e., reduced specificity), as suggested in figure 8(d). Using cmmPA and a simple CEM threshold of 0.5, the targeted area is fully isolated from the background (figure 8(d)). This result demonstrates that cmmPA can detect a very small number of targeted cells difficult to detect with mmPA alone because of incomplete background suppression.
3.4. Specificity
The use of US imaging for background suppression on a PA image involves two different imaging modalities. Generally, US speckle is obtained for most tissues whereas a targeted region can be localized in PA imaging. Here, two different implementations of cmmPA based on PAD and USD are compared for a larger number of targeted cells (10 000) enclosed in a PVA inclusion and sandwiched between two porcine liver slices. In figure (a), the resulting PA image (hot colormap, 60 dB dynamic range) is overlaid on the US picture (grayscale, 50 dB dynamic range). The tagged region has similar PA amplitude as the tissue surface despite light attenuation through the 2 mm of liver tissue. In this example, as the displacement amplitude is high, surrounding tissue also moves at least a few microns. Hence, cmmPA-USD fails to be truly specific with a CEM threshold of 0.5 as it isolates the targeted region but with additional surrounding tissue (see figure 9(b)). However, cmmPA-PAD accurately suppresses the background with a CEM threshold of 0.5. The reason is that only the region with high PA SNR leads to high CEM values. For surrounding tissue with a weaker PA signal, the CEM is low. Therefore, cmmPA-PAD has higher specificity while it usually has lower sensitivity than cmmPA-USD because of lower SNR. However, the specificity of USD can be recovered using a threshold on the displacement magnitude (3 μm here, see figure 9(d)) if the displacement magnitude is sufficiently above the noise limit of speckle tracking displacement measurements.
3.5. Motion robustness
In cmmPA, a narrowband magnetic excitation enables background physiological motion filtering. To evaluate the efficiency of such an approach with known background motion, a phantom experiment was performed using artificial axial motion (i.e., along the direction of the magnetic, z-axis) induced by a stage (500 μm amplitude, 1 Hz). Absolute displacements (see figure 10(a), orange curve) showed the trajectory of the targeted area. The magnetomotive displacement, generally on the order of a few to tens of micrometers for the current setup, cannot be distinguished from this large motion. Nevertheless, after high pass filtering of this curve, a 12 μm peak to peak amplitude curve was clearly synchronized with the magnetic excitation (see figure 10(b)). The CEM map (figure 10(c)) exhibited high contrast (CEM(MNP)—CEM(background) = 0.97) with a maximum CEM value of 0.76.
Due to current system limitations, a fixed number of images (400) can be recorded at once. With this limitation, a series of different experiments was performed by fixing the excitation frequency but changing the number of magnetic cycles. Note that the frame rate was changed, depending on the number of magnetic cycles. Using a low number of cycles, more images are acquired within the same cycles which can improve motion estimates. However, a low number of cycles does not provide enough information for the CEM. By increasing the number of cycles up to 8, the correlation contrast increases to high values for the static case (i.e., no background motion) and for each artificial motion (figures 10(d), 1 Hz, 2 Hz and 4 Hz). For higher number (>10) of cycles, the frame rate is not sufficient for good motion estimation given the magnitude of background motion. The CNR decreases then, despite the higher number of cycles for the CEM. Note that the contrast of the 4 Hz motion case is higher because of a lower displacement amplitude (10 μm) and a smaller displacement between frames. Thus, there exists a tradeoff between the number of cycles and frame rate; the optimal magnetic cycle number was about 8 in all these experiments.
4. Discussion
In this paper, we described the cyclic magnetomotive photoacoustic imaging technique using multiple cycle magnetic excitations. The time-coherence of induced displacements with respect to the excitation improves background suppression in terms of sensitivity and specificity. Coded magnetic excitations have been introduced to enhance peak-to-peak displacements through total cancellation of the magnetic field between each half-cycle. An optimal overshot was found for each frequency. For a given experiment, the influence of the number of cycles was then studied and an 8-cycle excitation was found to be efficient to obtain high contrast CEM for the present experimental setup.
The sensitivity of cmmPA was found to be higher than mmPA for very low displacements. cmmPA-USD showed a higher sensitivity than cmmPA-PAD. USD had lower specificity, however, for high displacement values since motion tracking can measure small coherent displacements of surrounding tissue which move because of displacement continuity. This feature limits the ultimate spatial resolution of such an approach. However, a threshold on tissue displacement can be used to recover specificity if displacement estimates have a high SNR. In some cases where displacements are small, combining CEM and PPD thresholds leads to better sensitivity and specificity than using only single information. One of the interests in using cmmPA is the robustness to physiological motion. In mmPA, if the magnetic field is applied while the medium is moving or deforming, the results can be wrongly interpreted. cmmPA was shown efficient in the presence of low frequency motion at different frequencies. The magnetic displacement was 2 orders of magnitude smaller than mimicked physiological motion. In the case of background motion, an 8-cycle magnetic excitation was shown to be the best tradeoff between the increase of CEM information and noise reduction using frame filtering for the current experimental setup.
Given the higher frame rate of ultrafast US imaging (up to ~10 kHz), it is possible to acquire PA images during US acquisition and combine PA-based cmmPA with US-based cmmPA to optimized both detection sensitivity and specificity. This would take advantage of all potential dead time during the imaging sequence.
This approach for in vivo molecular imaging requires a magnetic frequency away from physiological motion frequencies. Here we have used higher frequencies than the background motion but the magnetic frequency can be chosen lower as long as the imaging frame rate is sufficient to maintain high speckle tracking quality. However, a high frame rate in imaging will generally be more efficient given physiological motion such as breathing which ranges from a few tenths of a Hz to a few Hz. To use magnetic frequencies higher than ~20 Hz, the permeability of magnetic particles must be improved as well as the electromagnet and its drive system.
5. Conclusion
Using additional information about magnetic displacement coherence, cmmPA shows higher specificity than mmPA. The sensitivity of background suppression is also enhanced compared to mmPA methods based on displacement amplitude thresholding. It is possible to adjust the number of cycles to given situations. For very low displacements or SNR, an additional threshold on displacement amplitude can be used. The accuracy of background suppression in a moving target was shown in vitro and the existence of a tradeoff between frame rate and number of cycles was demonstrated in the case of a fixed number of frames. This technique could have potential for deep molecular imaging based on FDA approved contrast agents such as iron-oxide-based nanoparticles.
Acknowledgments
This work was supported in part by NIH RO1-EB016034, R01-CA170734, RO1-HL121226, RO1-HL125339, the Life Sciences Discovery Fund 3292512, NSF CBET-1236309, and the Department of Bioengineering at the University of Washington.
References
- [1].Copland JA, Eghtedari M, Popov VL, Kotov N, Mamedova N, Motamedi M and Oraevsky AA 2004. Bioconjugated gold nanoparticles as a molecular based contrast agent: implications for imaging of deep tumors using optoacoustic tomography Mol. Imaging Biol 6 341–9 [DOI] [PubMed] [Google Scholar]
- [2].Li P-C, Wei C-W, Liao C-K, Chen C-D, Pao K-C, Wang C-RC, Wu Y-N and Shieh D-B 2007. Photoacoustic imaging of multiple targets using gold nanorods IEEE Trans. Ultrason. Ferroelectr. Freq. Control 54 1642–7 [DOI] [PubMed] [Google Scholar]
- [3].Wei C, Lombardo M, Larson-Smith K, Pelivanov I, Perez C, Xia J, Matula T, Pozzo D and O’Donnell M 2014. Nonlinear contrast enhancement in photoacoustic molecular imaging with gold nanosphere encapsulated nanoemulsions Appl. Phys. Lett 104 033701. [DOI] [PMC free article] [PubMed] [Google Scholar]
- [4].Arnal B, Perez C, Wei C-W, Xia J, Lombardo M, Pelivanov I, Matula TJ, Pozzo LD and O’Donnell M 2015. Sono-photoacoustic imaging of gold nanoemulsions: I. Exposure thresholds Photoacoustics 3 3–10 [DOI] [PMC free article] [PubMed] [Google Scholar]
- [5].Arnal B, Wei C-W, Perez C, Nguyen T-M, Lombardo M, Pelivanov I, Pozzo LD and O’Donnell M 2015. Sono-photoacoustic imaging of gold nanoemulsions: II. Real time imaging Photoacoustics 3 11–9 [DOI] [PMC free article] [PubMed] [Google Scholar]
- [6].Wilson K, Homan K and Emelianov S 2012. Biomedical photoacoustics beyond thermal expansion using triggered nanodroplet vaporization for contrast-enhanced imaging Nat. Commun 3 618. [DOI] [PubMed] [Google Scholar]
- [7].Danielli A, Favazza CP, Maslov K and Wang LV 2011. Single-wavelength functional photoacoustic microscopy in biological tissue Opt. Lett 36 769. [DOI] [PMC free article] [PubMed] [Google Scholar]
- [8].Razansky D, Distel M, Vinegoni C, Ma R, Perrimon N, Köster RW and Ntziachristos V 2009. Multispectral optoacoustic tomography of deep-seated fluorescent proteins in vivo Nat. Photonics 3 412–7 [Google Scholar]
- [9].Qu M, Mallidi S, Mehrmohammadi M, Truby R, Homan K, Joshi P, Chen Y-S, Sokolov K and Emelianov S 2011. Magneto-photo-acoustic imaging Biomed. Opt. Express 2 385–96 [DOI] [PMC free article] [PubMed] [Google Scholar]
- [10].Mehrmohammadi M, Shin T-H, Qu M, Kruizinga P, Truby RL, Lee J-H, Cheon J and Emelianov SY 2013. In vivo pulsed magneto-motive ultrasound imaging using high-performance magnetoactive contrast nanoagents Nanoscale 5 11179–86 [DOI] [PMC free article] [PubMed] [Google Scholar]
- [11].Li J, Arnal B, Wei C-W, Shang J, Nguyen T-M, O’Donnell M and Gao X 2015. Magneto-optical nanoparticles for cyclic magnetomotive photoacoustic imaging ACS Nano. 9 1964–76 [DOI] [PMC free article] [PubMed] [Google Scholar]
- [12].Li J, Liu J, Wei C-W, Liu B, O’Donnell M and Gao X 2013. Emerging applications of conjugated polymers in molecular imaging Phys. Chem. Chem. Phys 15 17006–15 [DOI] [PMC free article] [PubMed] [Google Scholar]
- [13].O’Donnell M, Skovoroda AR, Shapo BM and Emelianov SY 2014. Internal displacement and strain imaging using ultrasonic speckle tracking IEEE Trans Ultrason. Ferroelectr Freq. Control 41 314–25 [Google Scholar]
- [14].Lubinski MA, Emelianov SY and O’Donnell M 1999. Speckle tracking methods for ultrasonic elasticity imaging using short time correlation IEEE Trans Ultrason. Ferroelectr Freq. Control UFFC-46 82–96 [DOI] [PubMed] [Google Scholar]


