
Figure 1.
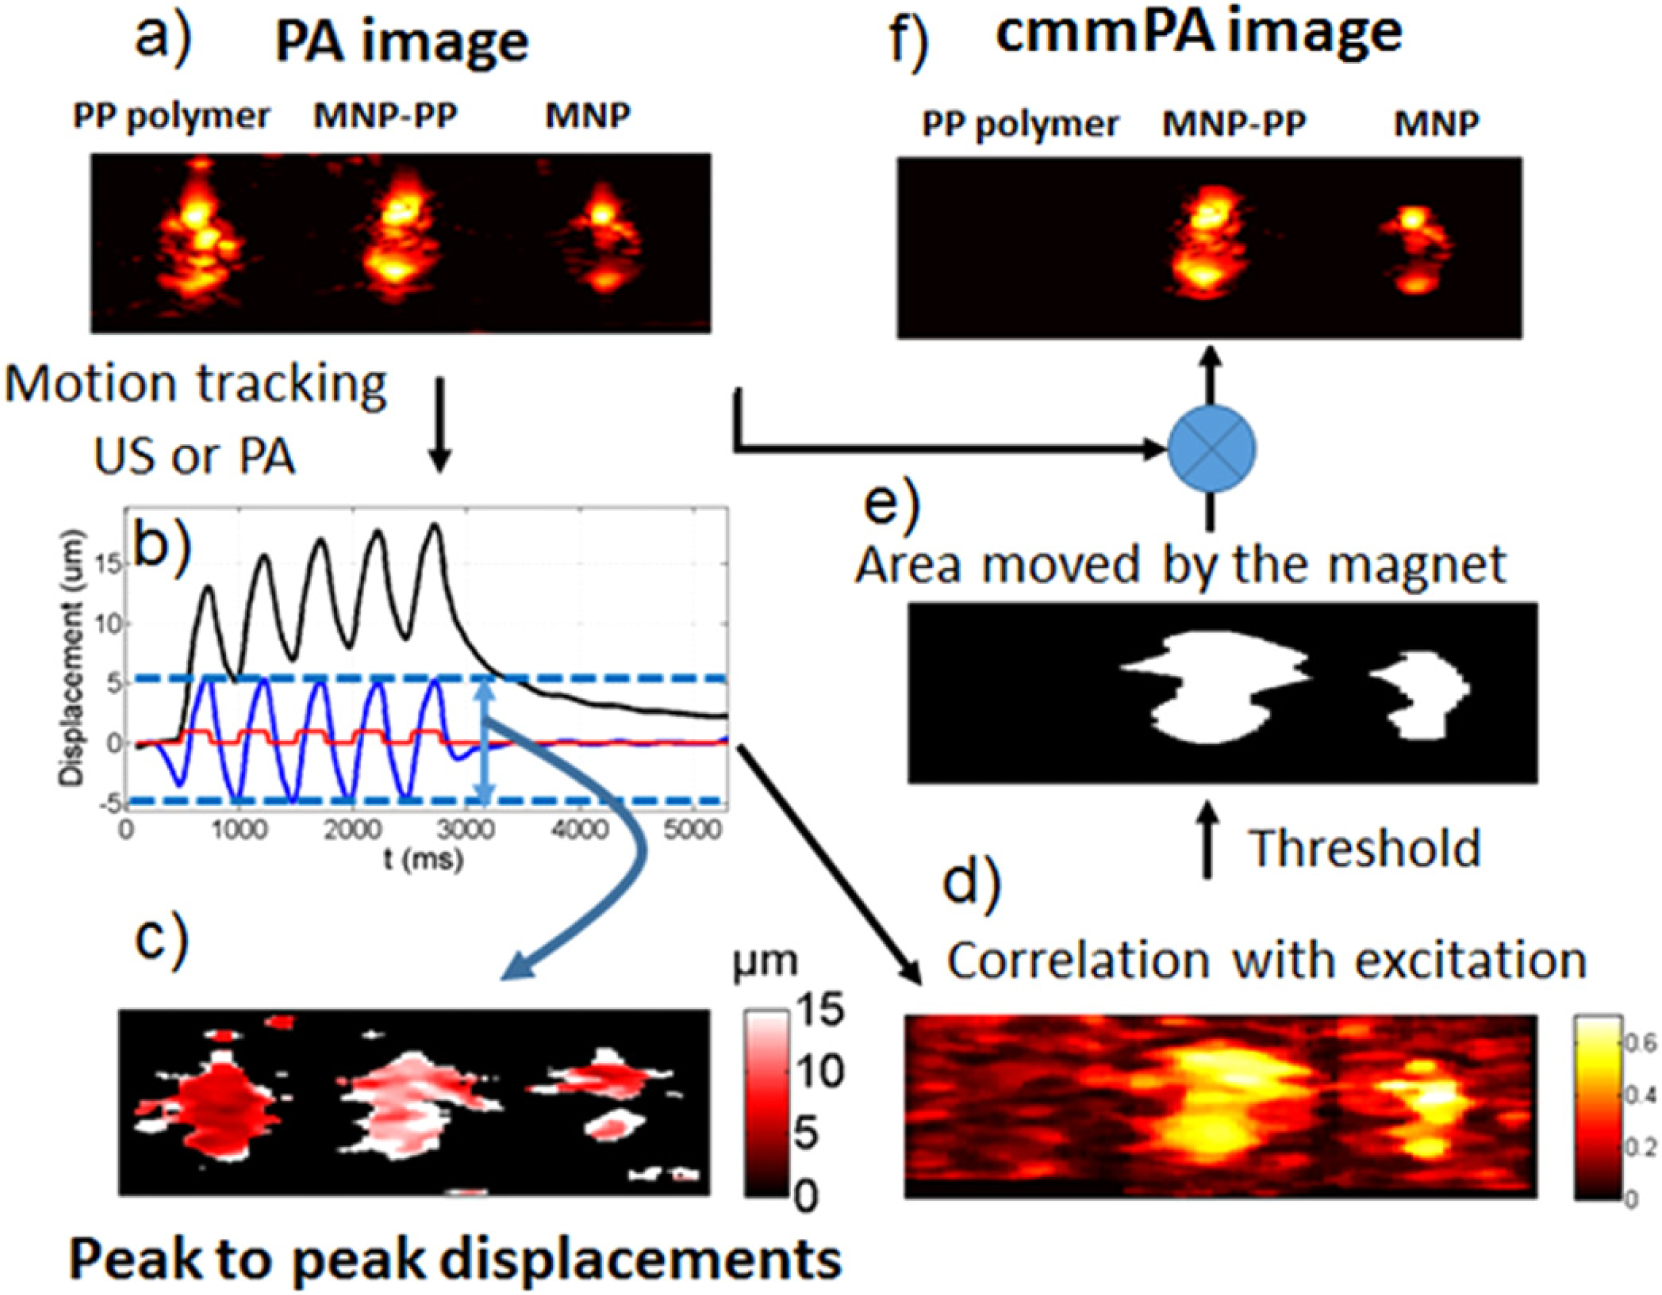
Principle of cmmPA and correlation with excitation masking. (a) PA image of three inclusions in a PVA gel (left to right: polypyrrole(Ppy), MNP-Ppy, MNP). (b) Resulting motion determined from US images over time for a 2 Hz excitation. Black: low-pass filtered displacements. Blue: band-pass filtered displacements. Red: magnetic excitation. (c) Peak to peak displacements. (d) Correlation with excitation map. (e) Threshold mask for a correlation value higher than 0.5. (f) Final cmmPA image.