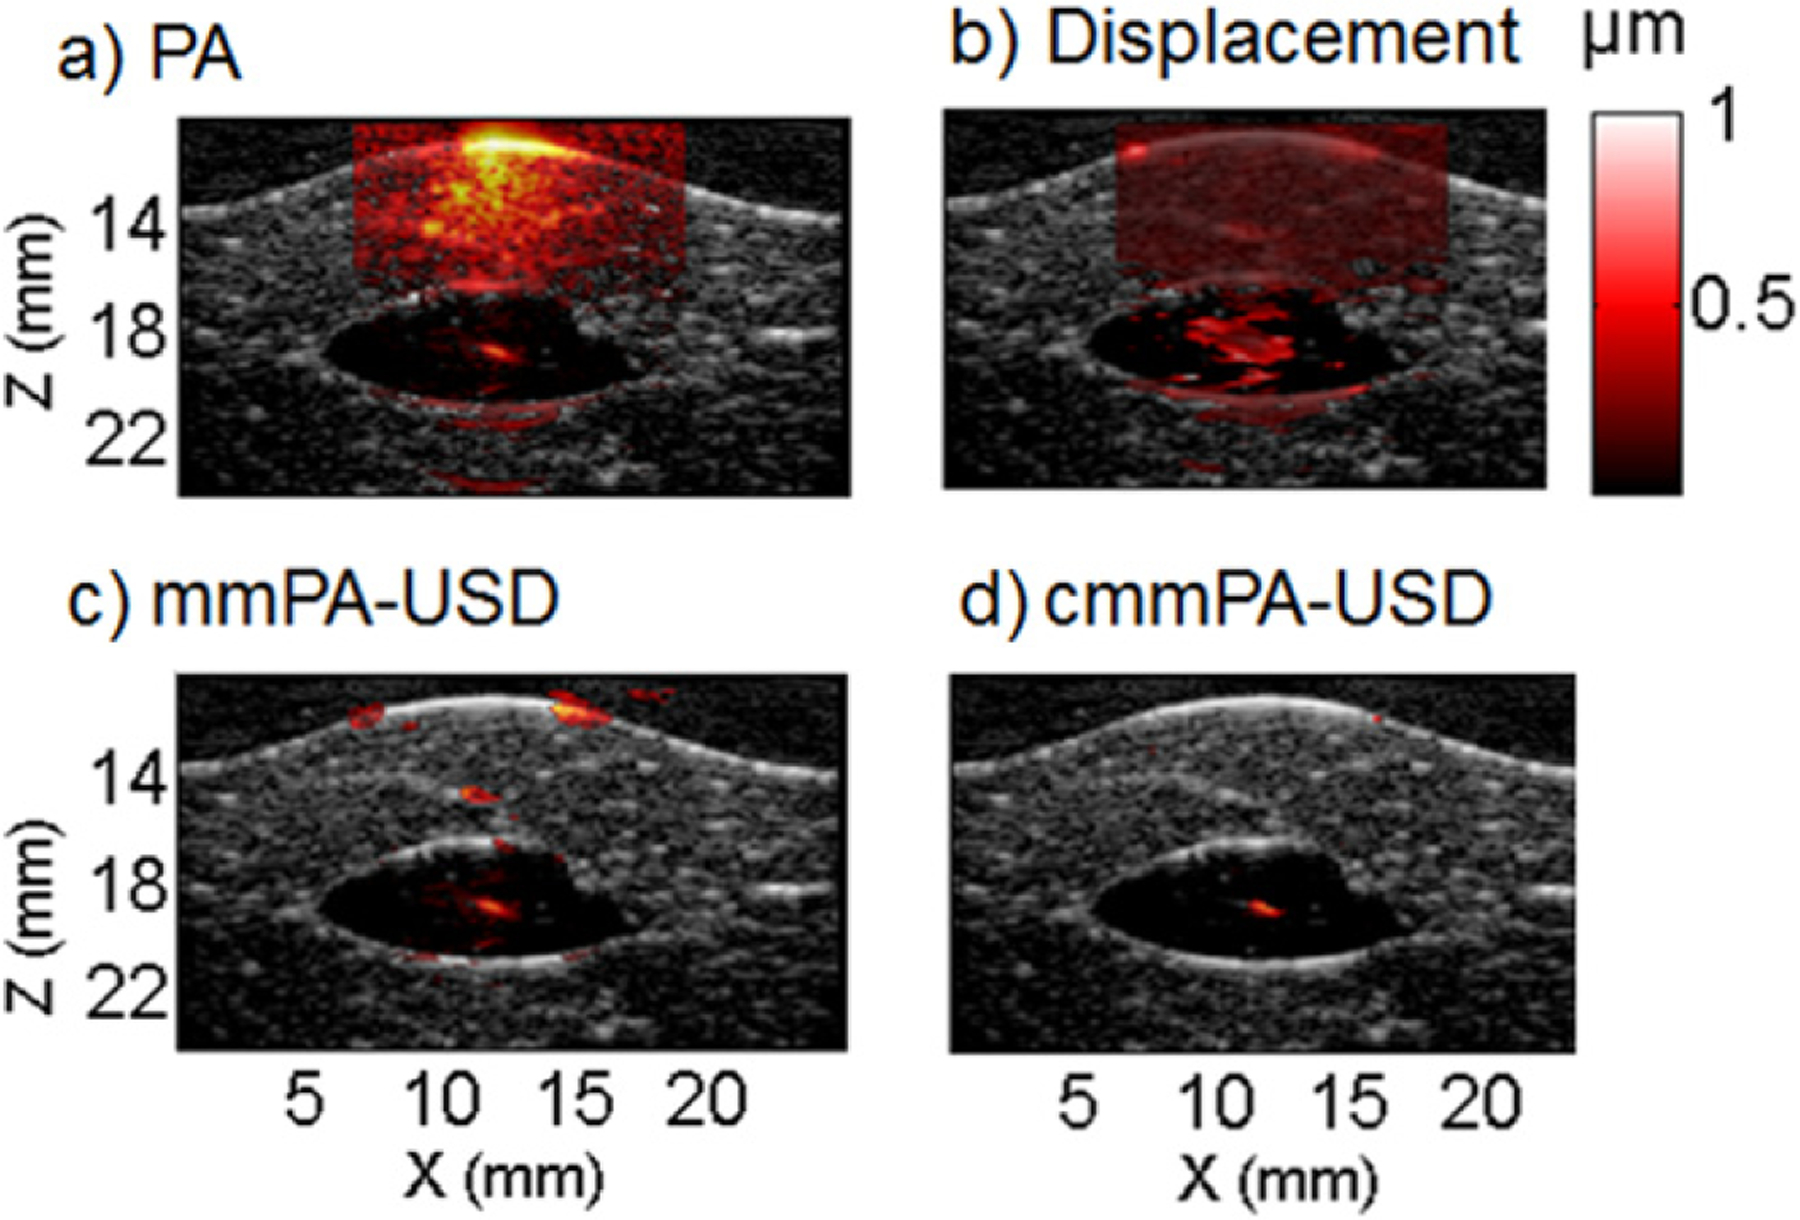
Figure 8.

Liver phantom with an inclusion of 500 tagged HeLa cells fixed in PVA. (a) Initial PA image. (b) Peak to peak displacements map. (c) mmPA image using a mmUS mask with a displacement threshold of 0.4 μm. (d) cmmPA image using a mmUS mask based on a correlation with excitation threshold of 0.5.
