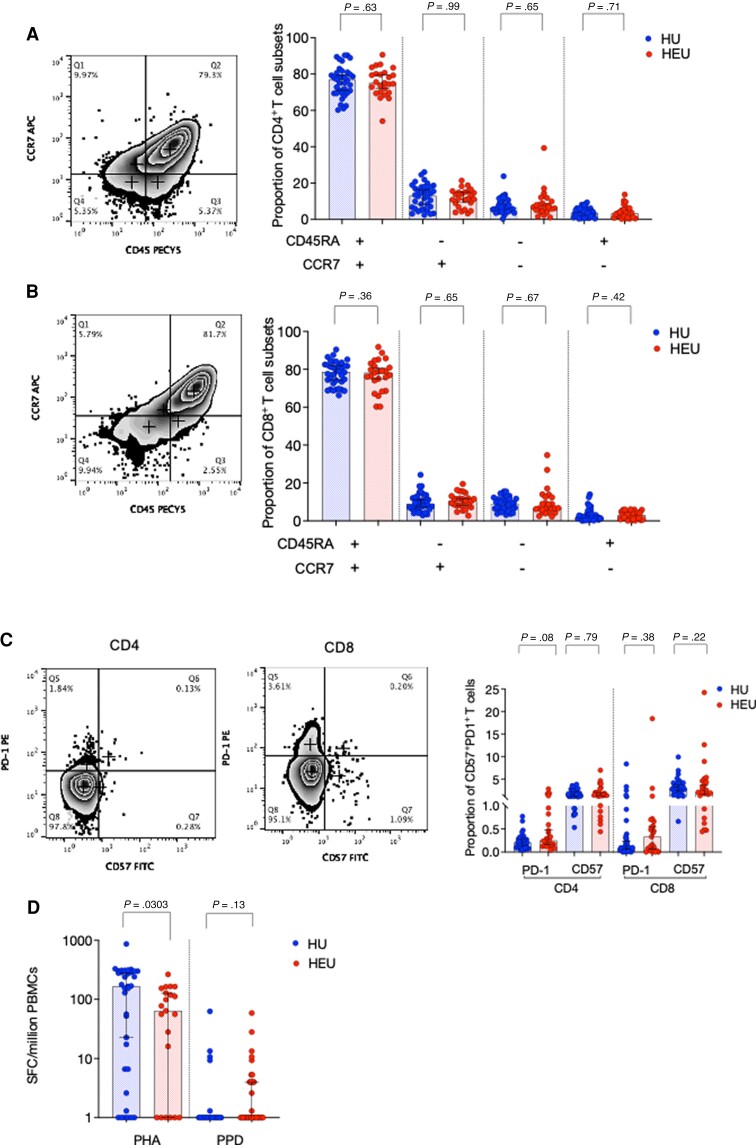
Figure 3.
Characterization of T-cell subsets in human immunodeficiency virus-exposed uninfected (HEU) and human immunodeficiency virus-unexposed uninfected (HU) newborns. Whole cord blood was stained with the following fluorochrome-conjugated antibodies: anti-CD3 APCCY7, anti-CD4 Pacific Blue, anti-CD8-FITC, anti-CCR7 APC, and anti-CD45RA. PECY7 were used to identify T-cell subsets. Singlets were defined using forward scatter (FSC)-A vs FSC-H parameters, and lymphocytes were gated using side scatter (SSC)-A and FSC-A. T cells were then gated using CD3 against SSC-A, then a CD4 versus CD8 plot was used to separate the 2 main T-cell subsets. A second panel of fluorochrome-conjugated antibodies—anti-CD3 APCCY7, anti-CD4 Pacific Blue, anti-CD8-PECY7, CD57 FITC, and PD1-PE—were used to measure T-cell senescence and exhaustion (HU, n = 36; HEU, n = 25). (A) CD4+ and (B) CD8+ T-cell subsets were clasified using CCR7 and CD45RA as follows: CCR7−CD45RA− (effector memory), CCR7+CD45RA− (central memory), CCR7+CD45RA+ (naive), and CCR7−CD45RA+ (terminally differentiated). (C) CD4+ and CD8+ T-cell subsets were clasified using CD57 (senescent) and PD-1 (exhausted) expression. (D) Isolated cord blood mononuclear cells were incubated with phytohemagglutinin (PHA) or purified protein derivative (PPD) for 18 hours, and interferon-γ-producing cells were detected on a 96-well microtiter enzyme-linked immunospot plate. The frequency of spot-forming cells (SFCs)/million cord blood mononuclear cells are plotted for all subjects (HU, n = 35; HEU, n = 21). Data were analyzed using Fisher’s exact test. Error bars depict medians (95% confidence interval).

