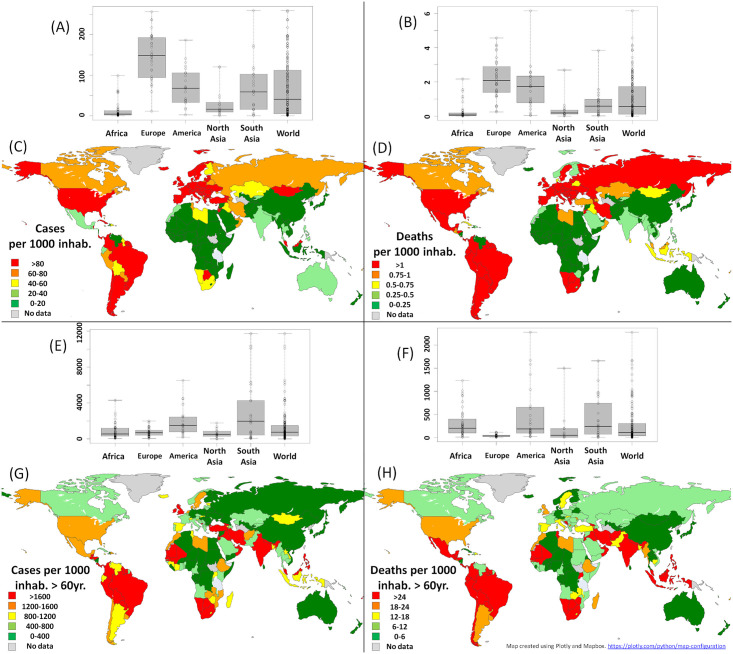
Fig 1. Statistical and geographical distributions of COVID-19 in the world.
Boxplots and geography of the numbers of COVID-19 cases (A and C) and deaths (B and D) per thousand inhabitants before health system correction is applied, and of the numbers of COVID-19 cases (E and G) and deaths (F and H) per thousand inhabitants of 60 years old and over, with health system correction based on the number of hospital beds per inhabitant applied. Geographical distributions resulting from these two factors separately are presented in S1 Fig. Results are presented for each continent separately (boxplots) and for the whole world (maps). Only countries with more than 1 million inhabitants are considered in the boxplots analysis where the rectangles correspond to the 25% and 75% centiles, and the extreme values to the minimum and maximum of the distributions; the central bar within the box corresponds to the median. Map created using Plotly and Mapbox. https://plotly.com/python/map-configuration.

