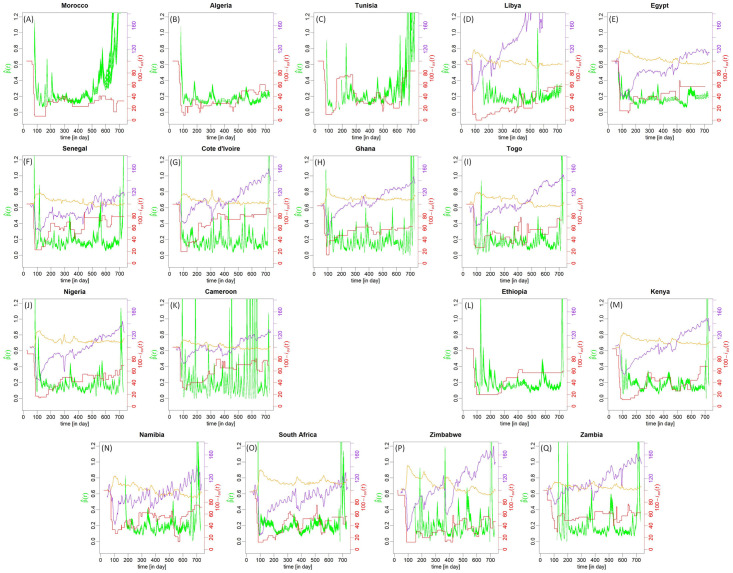
Fig 4. Average number of contact estimated per person per day.
Average number of contact per person per day (green lines) reconstructed from the daily time series of new cases from 23 January 2020 (day 23) to 18 January 2022 (day 740) for seventeen countries (panels are organised geographically on the figure). For each country, an ensemble of 54 estimations is presented, obtained by varying the exposure duration (from 4.5 to 5.5 days), the sickness duration (from 4.5 to 5.5 days), the distribution shape (three types) and the percentage of asymptomatic (from 25% to 35%). The (reversed) index of stringency 100 − iox(t) [in %] (red line), from the University of Oxford is also provided. When available, the percentage of residential duration (100 + iRD(t) in orange) and retail-recreation time (100 + iRR(t) in purple) are also plotted (in comparison to the median of the period 3 January to 6 February 2020 which represents 100%).

