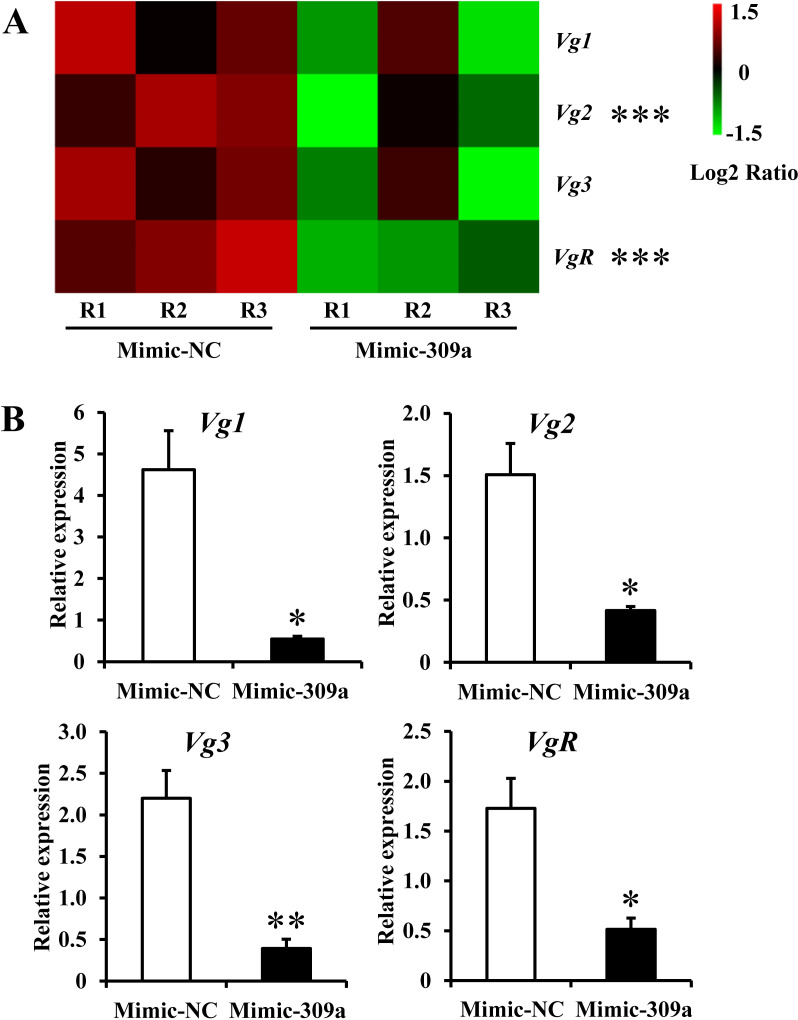
Fig 5. Relative expression of Vg-related genes (Vg1, Vg2, Vg3, and VgR) after mimic-309a injection.
(A) Illumina sequencing results. For the significance test: unmarked * indicates not significant; ***false discovery rate (FDR, an adjusted P-value) < 0.001 with log2|Fold change| > 2. R1, R2, and R3 indicate three independent biological replications. The color code indicates the fold change of the gene abundance in the form of a logarithm. The fragments per kilobase of exon per million fragments mapped (FPKM) of genes is normalized in each row. (B) qPCR results. a-tubulin and rps3 as reference genes were used to normalize the expression of Vg-related genes. The differences between means were analyzed by Student’s t test. For the significance test: *P < 0.05; **P < 0.01. Data are means ± SE (error bars) of four biological replications.

