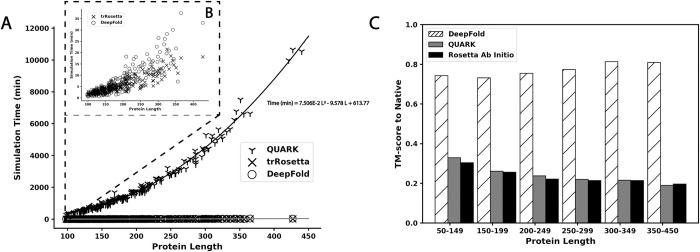
Fig 5. Dependence of the simulation time and TM-score on protein length.
A) Simulation runtime for QUARK, trRosetta, and DeepFold in minutes plotted against the protein length. B) A close up of the runtime vs protein length for DeepFold and trRosetta. C) Analysis of the average TM-score for DeepFold, QUARK, and Rosetta across different protein length ranges.

