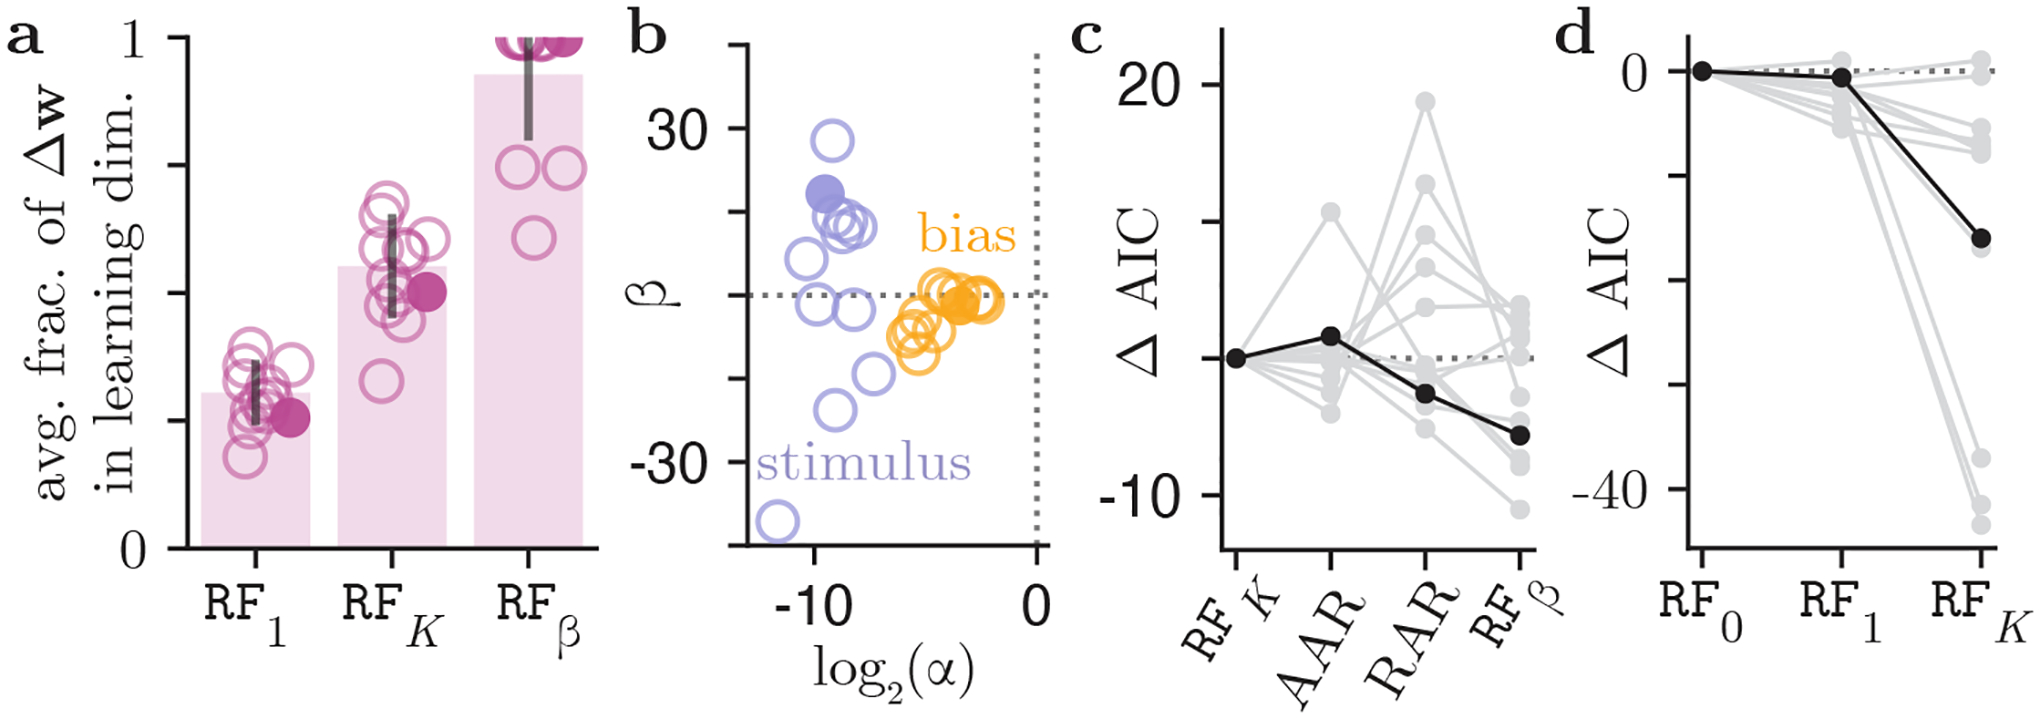
Figure 4:

Population analysis for 13 IBL mice. (a) The average fraction of the trial-to-trial weight updates along the learning direction, as prescribed by three learning models RF1, RFK, and RFβ. Each open circle represents a mouse; the example mouse from Fig. 3 is marked by a filled circle. The solid bars indicate the mean fraction across the animal cohort. Whereas the mean fraction of animals’ weight updates due to learning is just 0.30 for the RF1 model, it is 0.92 for the RFβ model. (b) The inferred learning rates and baselines, for the contrast and bias weights, from each mouse using the RFβ model. (c) Model comparison across learning rules within RF family, and beyond it (see Sec. 3.5 for a description of AAR and RAR learning rules), in terms of the difference in their Akaike Information Criterion (AIC) relative to the REINFORCE model (RFK). Each line is a mouse, and our example mouse is marked in black. (d) Model comparison within the family of REINFORCE models, with different numbers of varied learning rates. One outlier mouse was excluded from this figure for visibility (the AIC decreased by a massive 126.5 for the RFK model relative to the RF0 model). Our example mouse is marked in black.
