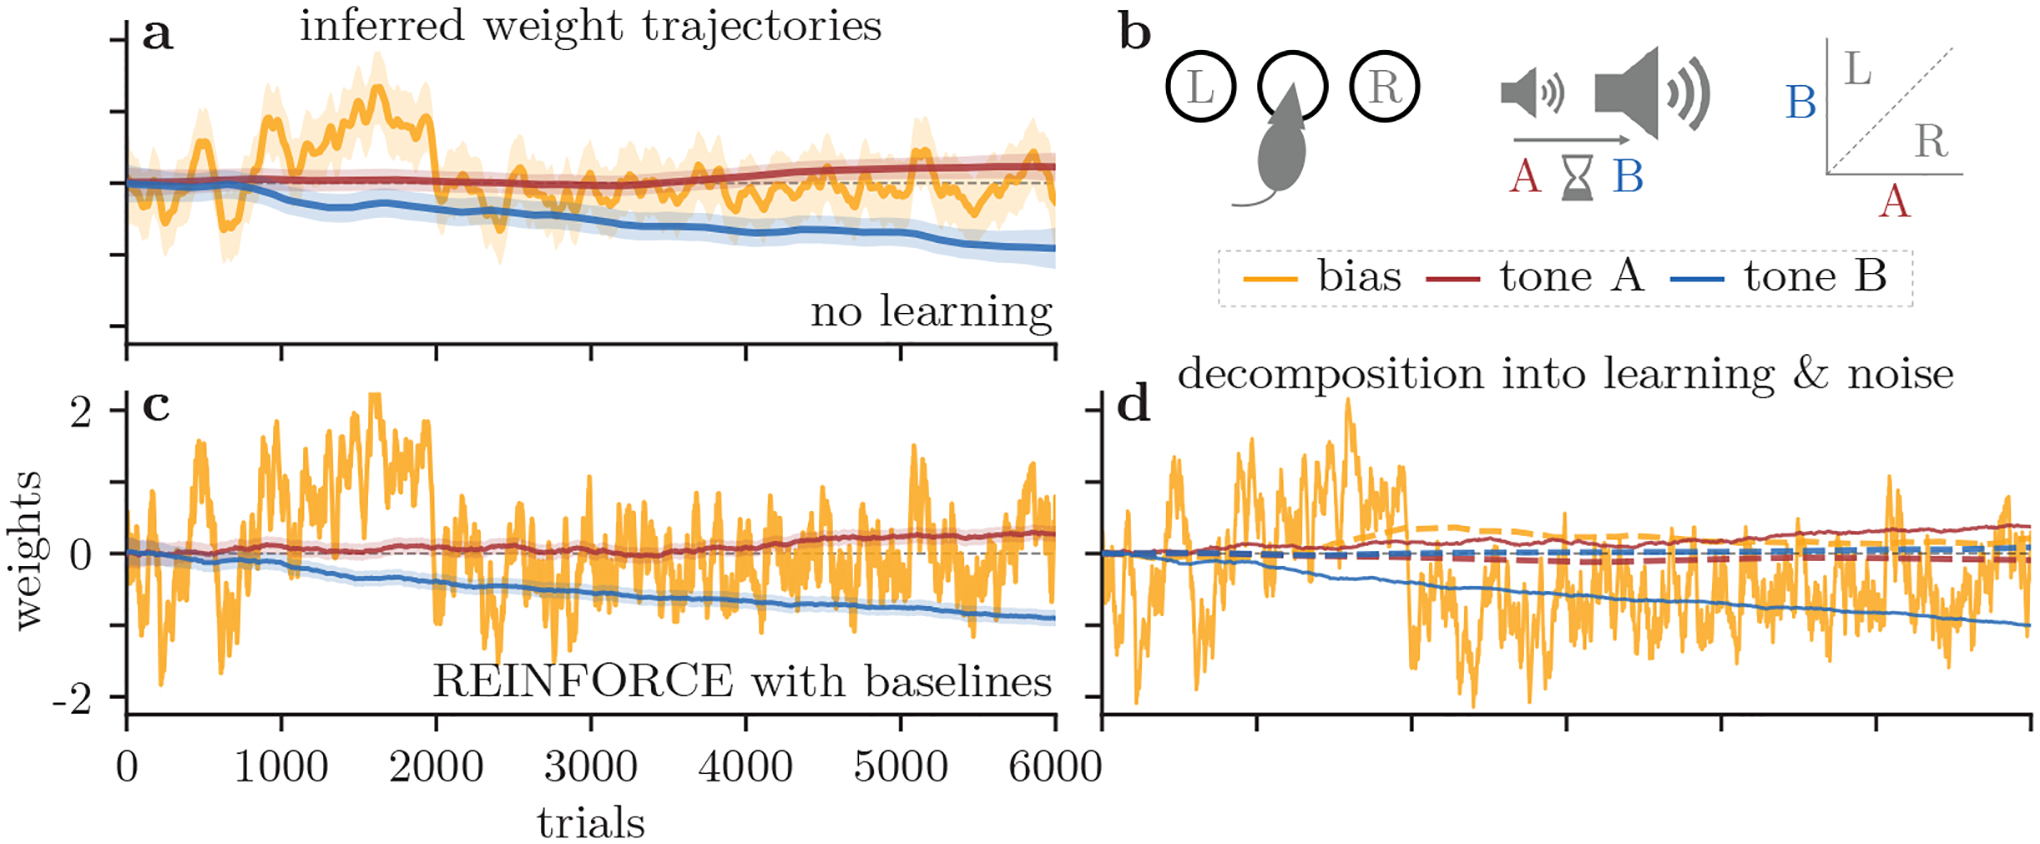
Figure 6:

Results from a rat auditory discrimination task [2]. (a) We track an example rat’s choice bias (yellow) and the sensitivity to two stimuli (red, blue) while training on the task described in (b). (b) In this task, a rat hears two tones of different amplitudes (tones A and B) separated by a delay. If tone A is quieter than B, the rat must nose-poke into the left port for reward, and vice-versa if tone A is louder than B. (c) We now use the RFβ model to predict how our rat updates its behavior. (d) The weights from (c) are decomposed into learning (solid) and noise (dashed) components, as in Fig. 3g.
