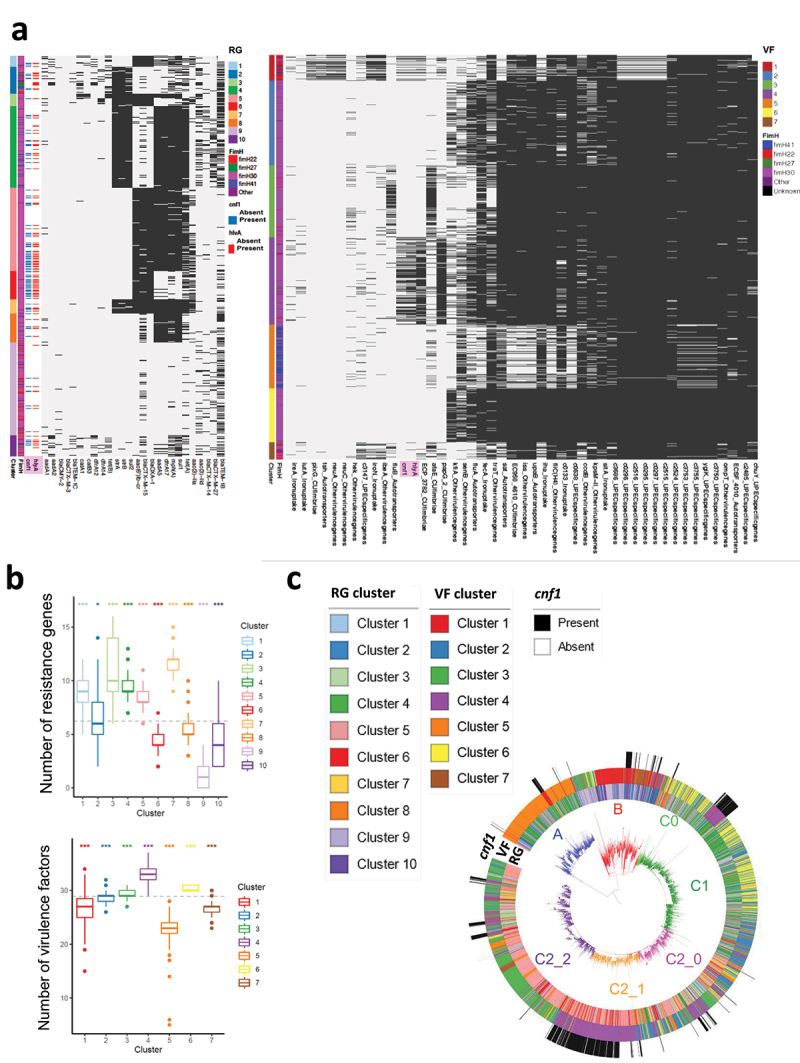
Figure 3.

Co-clustering of acquired antibiotic-resistance gene and virulence factors in E. coli ST131. A) Heatmaps show clusters of antibiotic acquired-resistance gene (RG) (left panel) or virulence gene (VF) (right panel) profiles (Sup. table S2) constructed using a binary latent block model between strains by row and RGs or VFs by column. Black lines indicate the presence of RG or VF in each strain. Annotations are displayed on the right of each heatmap: information about strain clusters and fimH alleles together with hlyA and cnf1 carriage. B) Box-and-whisker plot showing the distribution of strains according to their content of acquired antibiotic-resistance genes (upper panel) or content of virulence factors (lower panel). The dotted line shows the mean number of RG or VF. All one-versus-all comparisons of VF and RG contents between clusters (*P < 0.05, ***P < 0.001). C) RG, VF clusters and cnf1 carriage are displayed on the E. coli ST131 phylogenetic tree. The different clades and subclades A, B, C0, C1, C2_0, C2_1, C2_2 are highlighted in blue, red, light green, green, pink, Orange and purple respectively.
