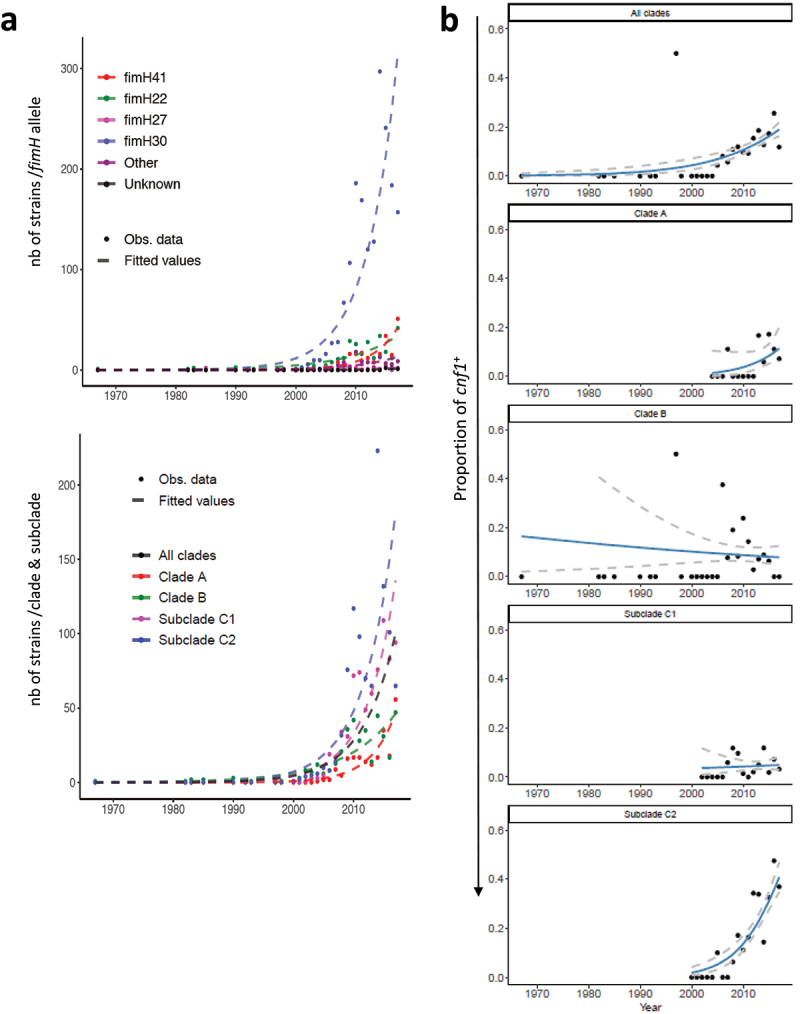
Figure 4.

Increase over the years in the proportion of cnf1-positive strains in E. coli ST131 H30Rx/C2. A) Distribution of fimH alleles (upper panel) or clades/subclades (lower panel) within the study population of E. coli ST131. Both figures show observed counts per year (dots) and data fitted lines (dashed lines) with a generalized linear model (Poisson regression). B) Increase of the proportion of cnf1-positive strains in the whole E. coli ST131 population along time (top panel, P = 7.41 10–7) and by clades and subclades. The black dots represent the observed proportion of cnf1-positive strains by year with fitted line of a logistic regression model (blue curves). Dashed gray lines display the 95% confidence intervals. The P-values are not significant for clade A (P = 0.287), B (P = 0.952), H30R/C1 (P = 0.992) and significant for H30Rx/C2 (P = 1.25 10−11).
