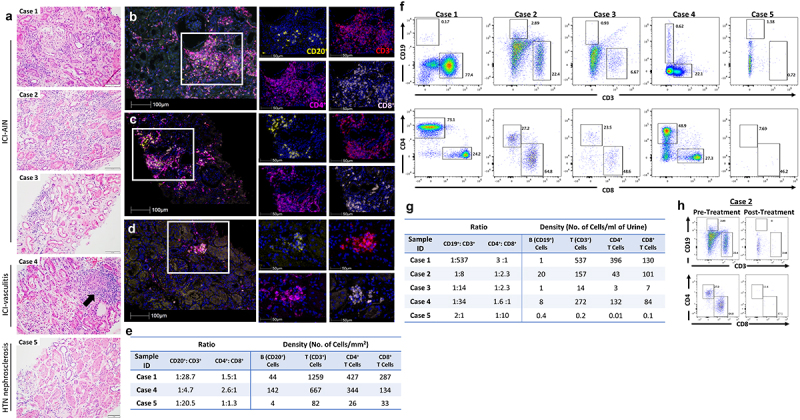
Figure 1.

Pathologic representative images. (a) Photomicrographs of hematoxylin and eosin (H&E)-stained renal tissue sections, 20x magnification. Case 1–3: active tubulointerstitial nephritis with lymphocytic tubulitis. Case 4: necrotizing vasculitis with granuloma formation (black arrow). Case 5: renal cortex without significant inflammation. (B, C, D) Multiplex immunofluorescence (mIF) staining with immune-oncology panel composed of anti-CD20 (yellow), anti-CD3 (red), anti-CD4 (magenta) and anti-CD8 (pink) antibodies for Case 1 (b), Case 4 (c) and Case 5 (d). mIF composite images (left) 20x magnification and details (right) 40x magnification. (e) Ratio of B to T cells and CD4+T to CD8+T cells and density of cells per mm2. Flow cytometric analysis was performed on mononuclear cells isolated from urine and frequencies and density of B (CD19+) and T (CD3+) cells in viable mononuclear cell fraction and CD4+ T and CD8+ T cells in T cell fraction were assessed. (f) Phenotypic profile of lymphocytes isolated from urine of Cases 1–5. (g) Ratio of B to T cells and CD4+ T to CD8+ T cells and density of cells in urine samples. (h) Phenotypic profile of lymphocytes isolated from urine of Case 2 pre- and post-corticosteroid therapy.
