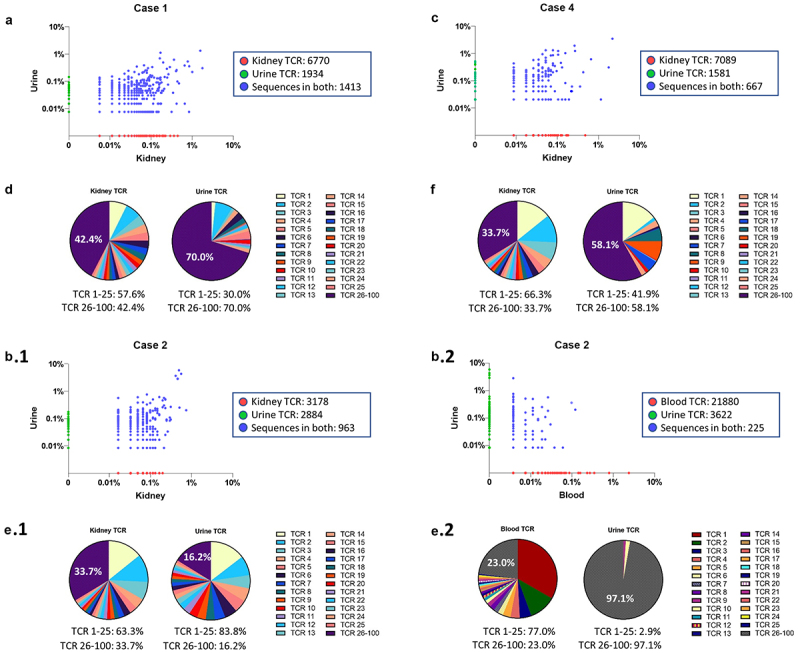
Figure 2.

Composition of TCR repertoires in Case 1, 2 and 4. (A, B, C) Scatterplot of TCRβ sequences in paired specimens. TCRβ sequences shared in paired specimens (blue dots). Non-shared TCRβ sequences are located on x-axis (red dots) or y-axis (green dots). (a) In Case 1, a total of 3,347 urine TCRβ sequences were detected (3,347 TCRβ = 1,413 shared TCRβ sequences + 1,934 TCRβ sequences unique to urine) where 42.2% urine TCRβ sequences were also found in the kidney TCRβ sequences. (B.1 and B.2) In Case 2, 25% urine TCRβ sequences (963 shared TCRβ sequences out of a total of 3,847 urine TCRβ sequences) were also found in kidney TCRβ sequences, but only 5.8% of TCRβ sequences in urine (225 shared TCRβ sequences out of a total of 3,847 urine TCRβ sequences) were found in blood TCRβ sequences. (c) In Case 4, approximately 29.7% of urine TCRβ sequences (667 shared TCRβ sequences out of 2,248 total urine TCRβ sequences) were shared with kidney TCRβ sequences. (D, E.1, F) Pie charts display the frequency of the top 25 productive kidney TCRβ sequences as a percent of the top 100 kidney TCRβ sequences. The top 25 kidney TCRβ sequences are identified in the urine and displayed as a percent of the top 100 urine TCRβ sequences. (E.2) The frequency of the top 25 blood TCRβ sequences are displayed as a percent of the top 100 TCRβ blood sequences. The top 25 blood TCRβ sequences are identified in the urine and displayed as a percent of the top 100 urine TCRβ sequences.
