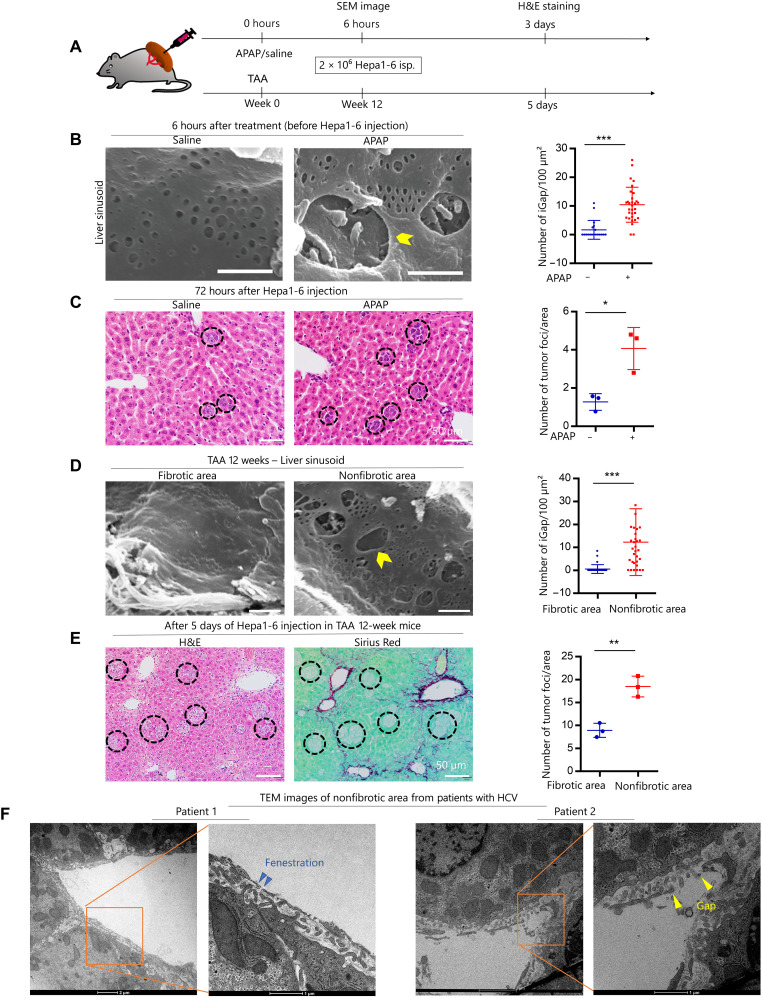
Fig. 1. Association of cancer cell invasion with chemically and fibrosis-induced LSECs-iGap.
(A) Schematic model of APAP/saline, thioacetamide (TAA) treatment, and liver metastasis using Hepa1-6 cell implantation in mouse spleens. (B) scanning electron microscopy (SEM) images show liver sinusoid 6 hours after intraperitoneal APAP or saline injection and quantification of the average number of LSECs-iGap per 100 μm2. Scale bar, 800 nm. (C) H&E staining shows multiple tumor foci (black circles) in the liver 3 days after Hepa1-6 cell injection. The average number of tumor foci per unit area. Scale bar, 50 μm. (D) SEM images show fibrotic and nonfibrotic areas in the liver sinusoid 12 weeks after TAA induction of liver fibrosis. Quantification of the average number of LSECs-iGap per 100 μm2. Scale bar, 800 nm. (E) Representative H&E (left) and Sirius Red (right) staining show tumor foci (black circles) in the liver 5 days after Hepa1-6 cell injection given 12 weeks after TAA injection. Scale bar, 50 μm. The average number of tumor foci was quantified in the fibrotic or nonfibrotic area. (F) Representative TEM images show LSECs-iGap in nonfibrotic areas of livers in patients with HCV (hepatitis C virus) infection and liver fibrosis. An enlarged view of the TEM image shows fenestration (blue arrowhead) and LSECs-iGap (yellow arrowhead) of approximately 150 nm and 1 μm in diameter, respectively. Scale bar, 1 μm. All quantification data are from at least 25 random fields and presented as the means ± SD. N = 3 independent experiments for each triplicate per group. *P < 0.05, **P < 0.01, and ***P < 0.001, two-tailed unpaired Student’s t tests.

