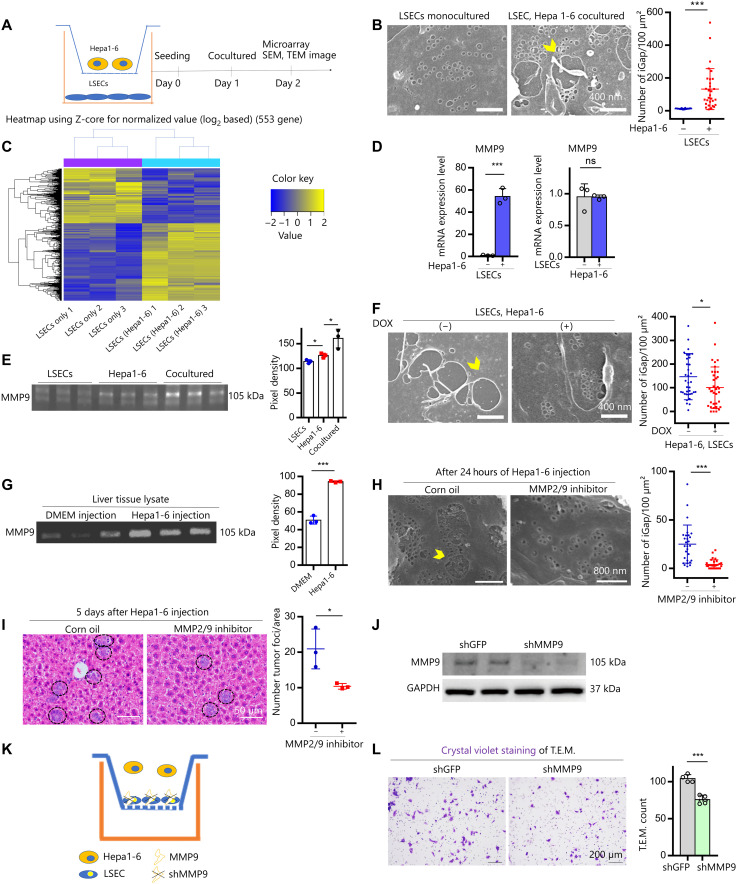
Fig. 3. Effects of MMP9 activity on cancer cell transmigration via LSECs-iGap.
(A) Scheme of the transwell system separating LSECs (bottom) from Hepa1-6 cells (inset). (B) Representative SEM images of monocultured LSECs and cocultured LSEC–Hepa1-6 cells after 24 hours. Scale bars, 400 nm. (C) Heatmap of DEGs (553 genes, >2-fold expression change, P < 0.05) between monocultured LSECs and cocultured LSEC–Hepa1-6 cells. (D) MMP9 mRNA expression by quantitative RT-PCR (qRT-PCR) in LSECs (left) and Hepa1-6 cells (right). ns, not significant. (E) MMP9 activity in conditioned medium from LSEC and Hepa1-6 cell mono- and cocultures. (F) Representative SEM images of LSECs-iGap after 24 hours of coculture with Hepa1-6 cells with or without DOX pretreatment. Scale bars, 400 nm. (G) MMP9 activity in liver lysates from DMEM (control) or Hepa1-6 cell–injected mice. (H) Representative SEM images of LSECs-iGap after intrasplenic injection of Hepa1-6 cells with or without MMP2/9 inhibitor. Scale bars, 800 nm. (I) Representative H&E staining of tumor foci (black circles) in liver 3 days after intrasplenic injection of Hepa1-6 cells. Scale bars, 50 μm. (J) Immunoblots of MMP9 in LSECs transfected with shGFP (control) or shMMP9. GAPDH, glyceraldehyde phosphate dehydrogenase. (K and L) Diagram (K), images, and quantification (L) of T.E.M. assays; Hepa1-6 cells transmigrate through an LSEC monolayer. Average number of tumor foci per area (I) and LSECs-iGap per 100 μm2 (B, F, and H). Gelatin zymography was quantified with pixel density (E and G), N = 3 per group. Yellow arrowheads indicate LSECs-iGaps. Data are shown as means ± SD. *P < 0.05 and ***P < 0.001, two-tailed unpaired Student’s t tests and one-way analysis of variance (ANOVA) (E).

