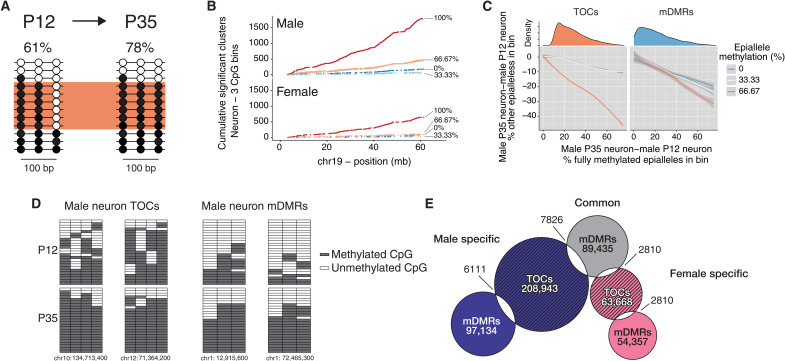
Fig. 2. Read-level analysis indicates epigenetic maturation in subsets of ARH neurons.
(A) Methylation changes that occur in only a subset of ARH neurons (orange box) may not be detected by conventional DMR callers; at each age, average methylation across all reads is shown. (B) Cumulative frequency along chromosome 19 of epiallele methylation states enriched in P35 relative to P12 neurons. Data are shown for three-CpG genomic bins by bin average methylation (0%: 000; 33.3%: 100, 010, or 001; 66.7%: 101, 110, or 011; 100%: 111; unmethylated/methylated CpGs represented by 0/1). The dominant feature is the enrichment of new 100% methylated clusters. (C) For such regions (left), proportional losses of partially methylated clusters (y axis) are plotted versus corresponding gains of fully methylated clusters at P35 relative to P12. The steep orange line indicates that most increases in fully methylated clusters arise from 66.7% methylated clusters (i.e., just one additional CpG site methylated); we call these TOCs. By contrast, at mDMRs (right), gains in fully methylated clusters arise equally from all other epialleles. Density distributions (top) show that most TOCs involve fewer than 40% of the reads in each bin. (D) Plots of read-level methylation and epiallele proportions in representative male neuronal TOC and mDMR bins. In the grids, rows and columns represent sequence reads and CpG sites, respectively. (E) Venn diagram illustrates numbers and overlaps of TOCs and mDMRs identified in male and female ARH neurons.

