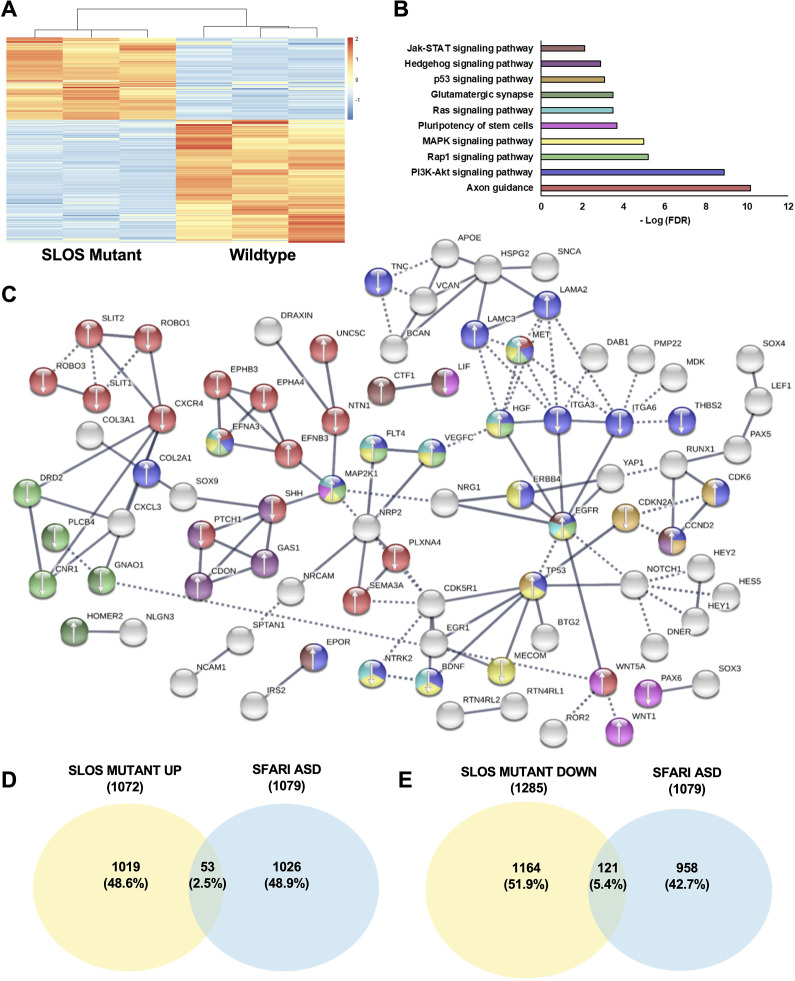
Figure 7. Loss of Dhcr7 alters gene expression in cultured SLOS patient-derived neural progenitors.
(A) Hierarchical clustering heatmap of differentially expressed genes shows distinct expression pattern changes in transcript abundance for SLOS mutant NPCs as compared to Controls. Red color represents an increase in abundance, blue color represents a relative decrease, and white color represents no change. (B) Enriched KEGG pathways identified among DEGs from SLOS mutant NPCs and involved in the Biological Function ‘development of the central nervous system’, identified by Ingenuity Pathway Analysis (see Supplementary file 5). Color of the bar corresponds to DEGs in the STRING network that are in enriched pathways. (C) String analysis of DEGs from SLOS mutant NPCs and involved in the Biological Function ‘Development of the central nervous system’ identified by Ingenuity Pathway Analysis. Parameters of high confidence have been applied and only connected nodes are displayed. Arrows indicate whether the gene was up- or down-regulated. Color of DEG corresponds to enriched KEGG pathway. (D) Venn diagram showing the overlap of autism risk genes in the SFARI database with genes upregulated in SLOS mutant NPCs. (E) Venn diagram showing the overlap of autism risk genes in the SFARI database with genes downregulated in SLOS mutant NPCs. n=3 biological replicates per genotype; DEGs met the criteria of fold-change >1.5 between genotypes and adjusted p-value < 0.05.

