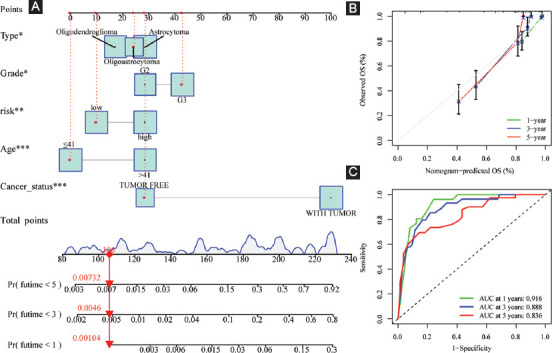
FIGURE 11.

Creation and verification of the risk score-based nomogram plot. (A) A nomogram of LGG was used to predict 1-year, 3-year, and 5-year survival rates; (B) calibration curves for accuracy validation of the nomogram; and (C) the AUC values of the ROC curves for improved evaluation of the prognostic ability of the nomogram.
