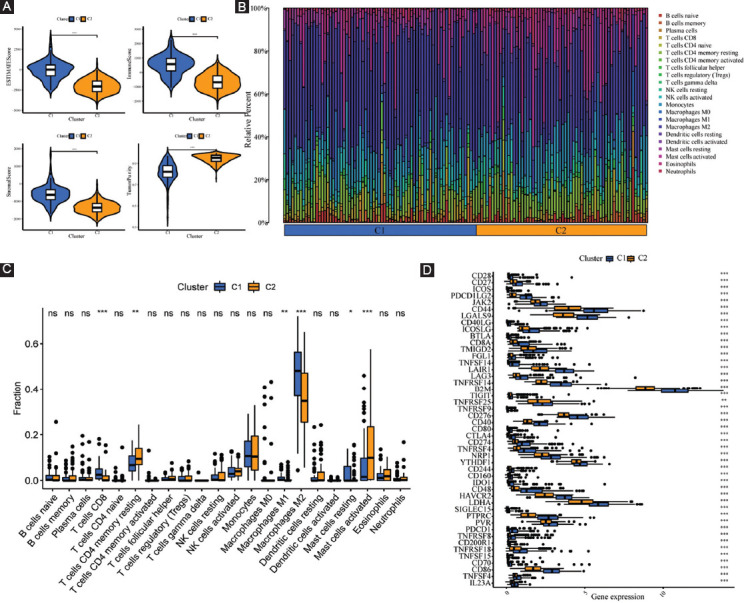
FIGURE 4.

Systematic analysis of TME scores and immune cell infiltration in two molecular subtypes. (A) Comparison of TME components; (B) the proportions of 22 subsets of tumor-infiltrating immune cells in different subtypes; (C) discrepancy analysis of tumor-infiltrating immune cells in different subtypes; and (D) differential expression analysis of 47 immune checkpoints genes between two molecular subtypes.
