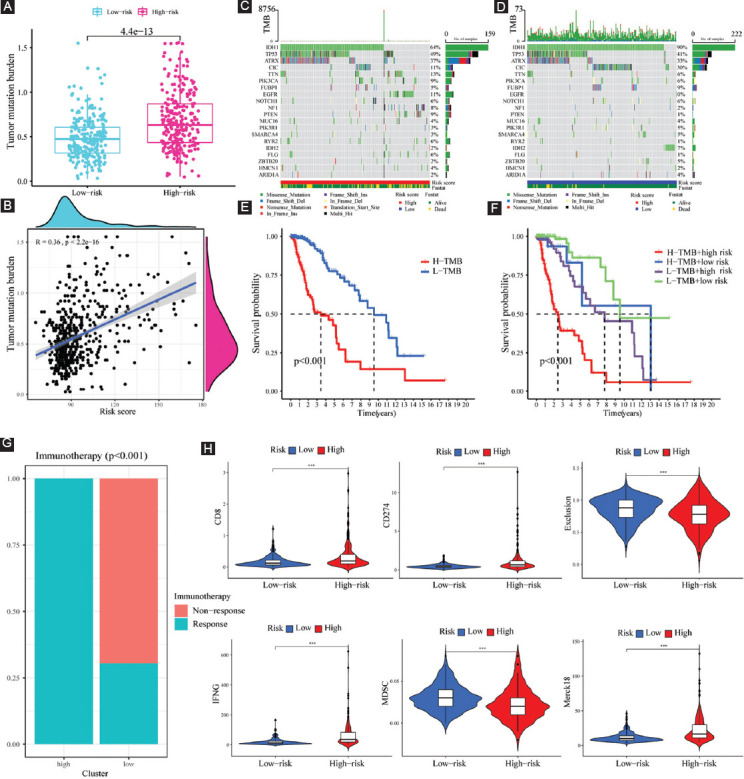
FIGURE 9.

TMB analysis and immunotherapy response prediction in the training cohort. (A) TMB difference between high- and low-risk subgroups; (B) correlation analysis between risk score and mutation load; (C and D) OncoPrint of frequently mutated genes in high- and low-risk subgroups; (E) Kaplan–Meier curve of OS for patients represented by the samples classified by risk score; (F) Kaplan–Meier curve of OS for patients represented by the samples classified by both the risk score and TMB score; (G) the discrepancy of immunotherapy response in low- and high-risk subgroups; and (H) immunotherapy response prediction in the training cohort.
