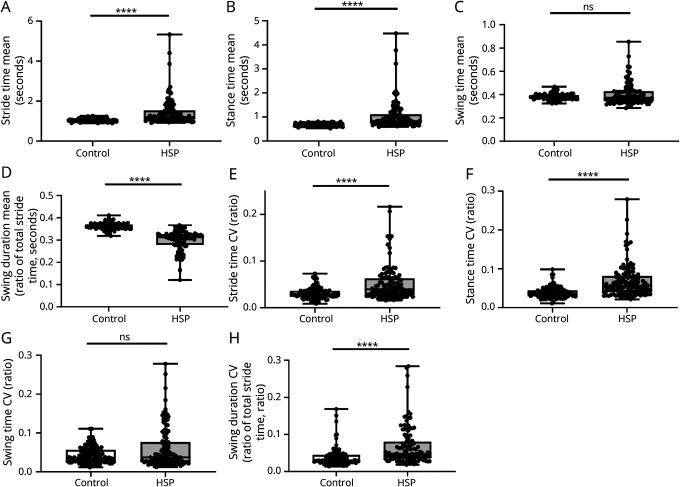
Figure 2. Mobile Gait Parameters in Patients With HSP and Controls.
Differences in mobile gait parameters comparing HSP and controls. (A–D) Absolute values for (A) stride time, (B) stance time, (C) swing time, and (D) swing duration (ratio of total stride time). (E–H) In addition, respective CVs were compared between controls and HSP. n = 112 for controls and HSP; ****p < 0.0001 according to the unpaired Mann-Whitney U test. CV = coefficients of variation; HSP = hereditary spastic paraplegia; ns = not significant; SPRS = Spastic Paraplegia Rating Scale.

