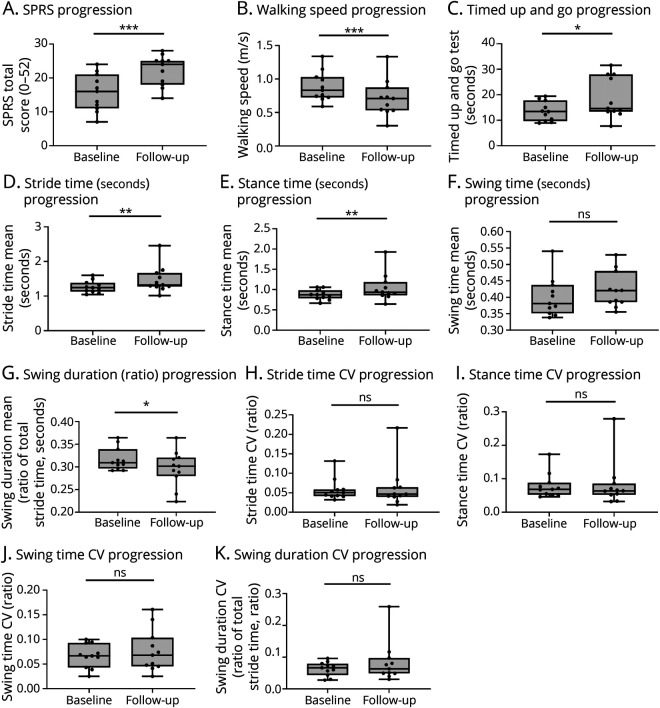
Figure 5. Longitudinal Progression of Mobile Gait Parameters in a Subcohort.
Longitudinal progression of gait impairment and mobile gait parameters in a subset of patients with complicated, fast progressing HSP after 1 year. (A) SPRS values, (B) walking speed over 10 m, and (C) time to complete the timed up and go task at baseline and follow-up. (D–G) Absolute values for (D) stride time, (E) stance time, (F) swing time, and (G) swing duration (ratio of total stride time) at baseline and follow-up. (H–K) Respective CVs at baseline and follow-up. n = 11; ns = not significant; *p < 0.05, **p < 0.01, ***p < 0.001, according to the Wilcoxon signed rank test. CV = coefficient of variation; HSP = hereditary spastic paraplegia; SPRS = Spastic Paraplegia Rating Scale.

