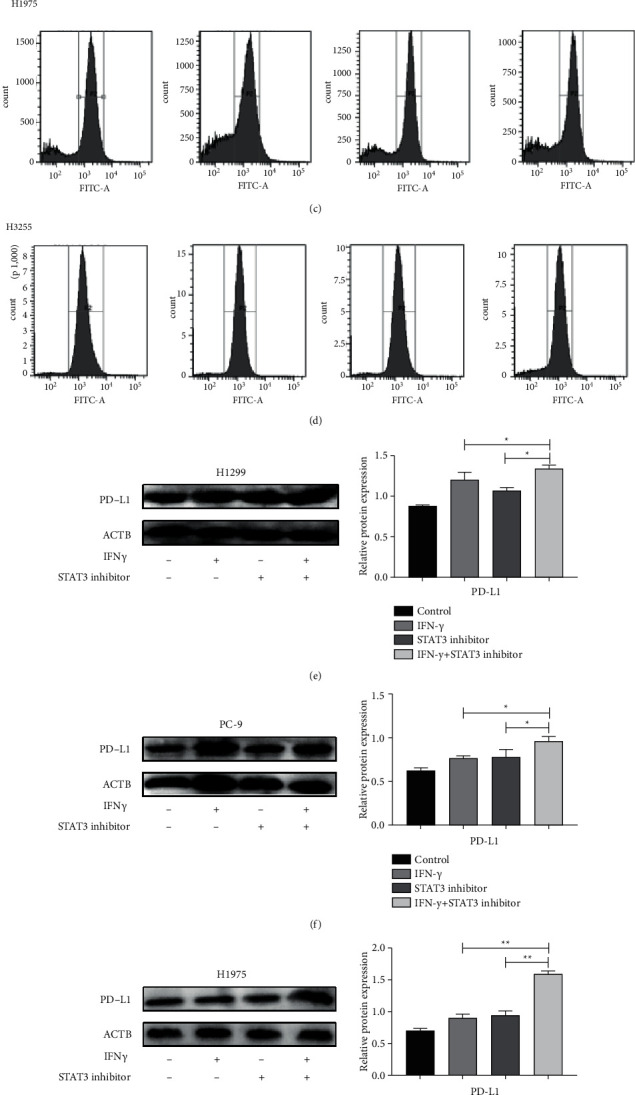
Figure 6.

Inhibition of STAT3 phosphorylation further induced PD-L1 expression. (a)–(d) The different levels of PD-L1 expression in NSCLC cells (H1299, H1975, PC9 and H3255) treated with or without IFNγ/STAT3 inhibitor by flow cytometry. (e)–(h) The protein expression level of PD-L1 in NSCLC cells (H1299, H1975, PC9 and H3255) treated with or without IFNγ/STAT3 inhibitor. All data was illustrated as mean ± SD (∗P < 0.05∗∗P < 0.01).
