
Fig. 4.
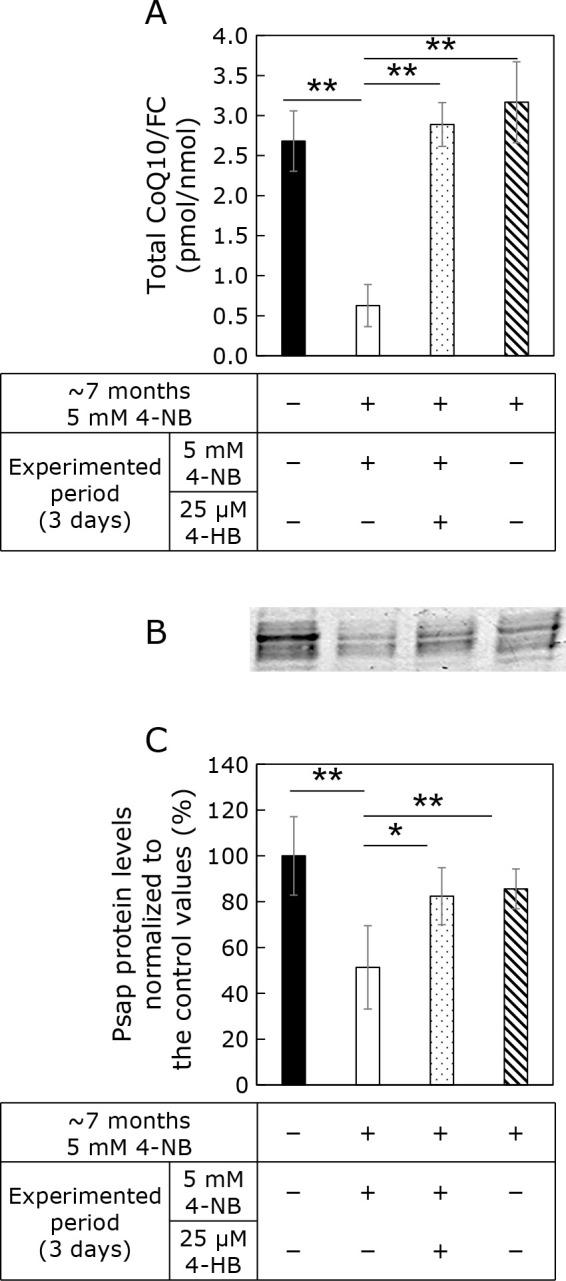
Effect of 4-NB and 4-HB treatments on CoQ10 and Psap protein levels. Cells were treated or not with 4-NB for 7 months. Then, the cells were divided into three groups: cells treated with 4-NB, cells cotreated with 4-NB and 4-HB (4-NB + 4-HB), and 4-NB removed medium. (A) CoQ10 quantification in the cells. (B) Western blot analysis of Psap. (C) Quantification of Psap protein levels using ImageJ. Data are expressed as mean ± SD. The statistical analysis was conducted by one-way analysis of variances. *p<0.05, **p<0.01 vs control.