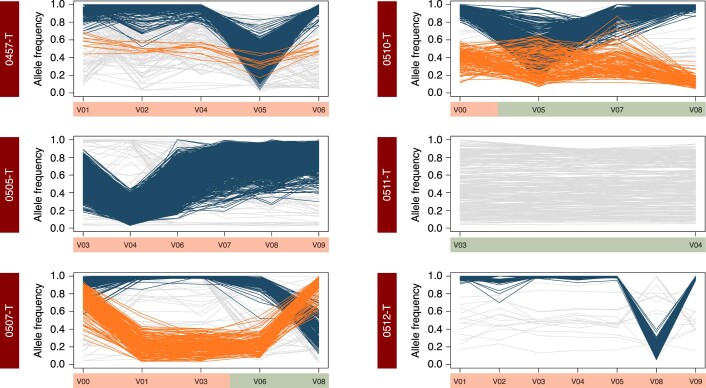
Extended Data Fig. 8. Sub-strain variations in K. pneumoniae.
Sub-strain variations over time for other individuals (K. pneumoniae). Figures were plotted for subjects with ≥2 single-strain timepoints. Coloured lines depict clusters of SNVs that were identified. Timepoints are shaded based on whether they were determined to be CPE colonized (red) or not (green). Note that similar to the observation in Extended Data Fig. 7, the dominant sub-strain in a subject can switch at timepoints that do not coincide with change in CPE colonization status (for example, V01 and V08 for 0507-T).

