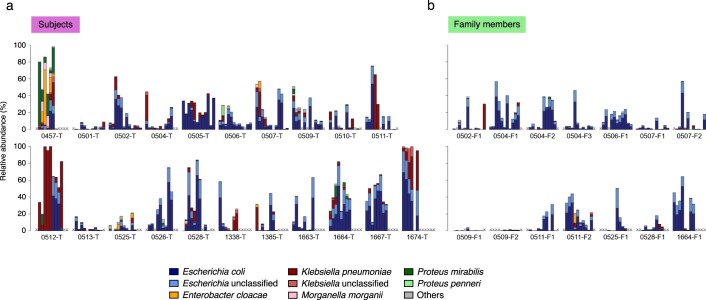
Extended Data Fig. 5. Enterobacteriaceae relative abundances.
Bar plots showing the relative abundances of various Enterobacteriaceae species in (a) subjects and (b) family members, over the course of sample collection. Each sub-panel consists of 12 bars, representing consecutively visit 0 (V00) to visit 11 (V11). An ‘X’ at a particular position indicates that a sample corresponding to that visit number was not collected. Only individuals with samples collected at six or more visits are shown.

