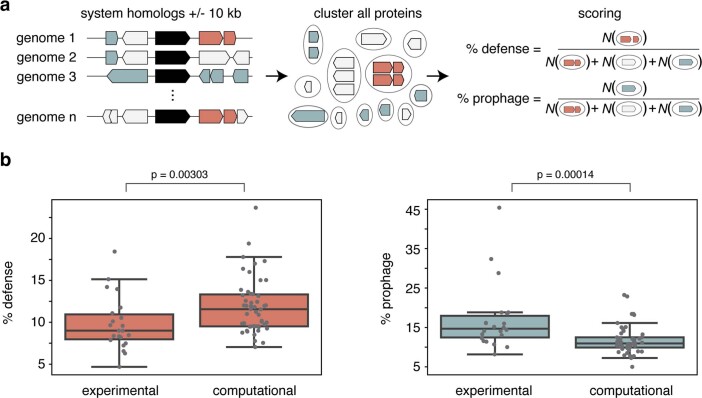
Extended Data Fig. 6. Comparison of defense and prophage enrichments between experimentally and computationally discovered systems.
(a) Overview of method. Genes + /- 10 kb of homologs of defense systems were predicted as defense- or prophage-associated. To minimize the effects of sequence/genome redundancy, proteins were clustered to 95% identity. % scores were calculated as the number of prophage or defense-associated clusters over total clusters. (b) Boxplots of % prophage- and defense-associated genes near the experimentally discovered systems (this study) or computationally predicted and validated systems12,13. p values indicate significance from two-sided Mann-Whitney U test. Boxes indicate bounds of the distribution as median + /- quartiles, and limits exclude outliers.

