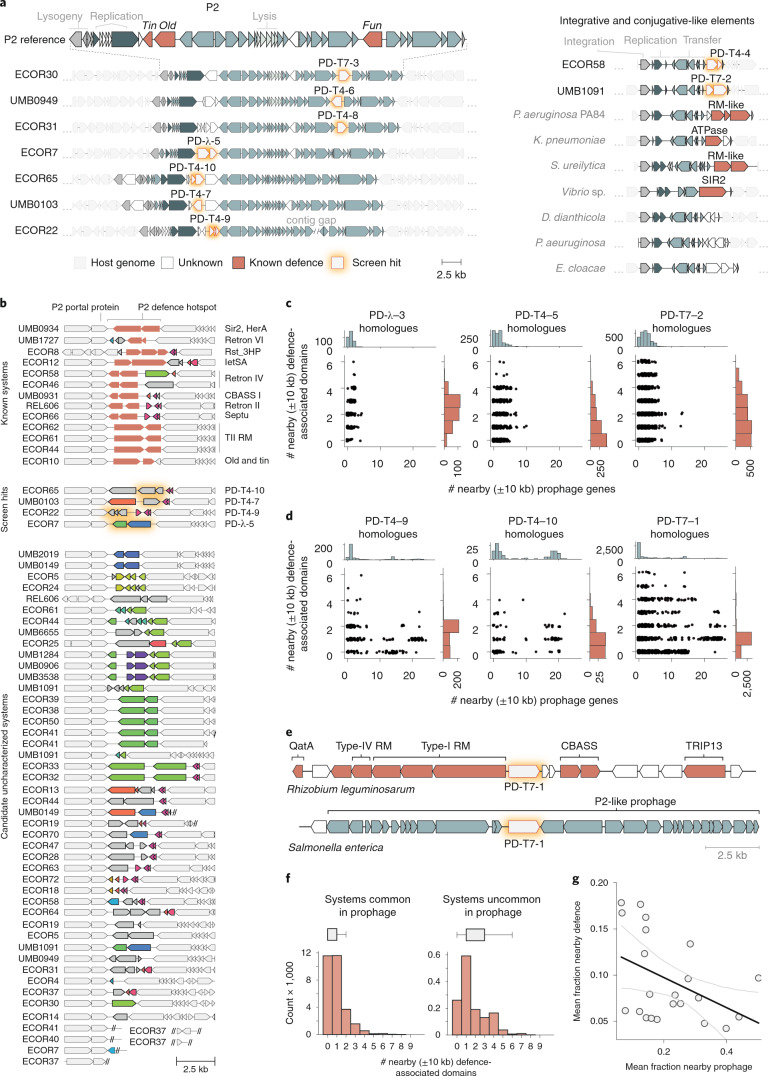
Fig. 4. Prophages and MGEs are major sources of defence systems.
a, Hotspots of previously uncharacterized defence systems. Left: the native genome context of seven defence systems identified here, showing the boundaries of P2-like prophages in the genome from which they originated. Genes are colour-coded as indicated at the bottom. Right: two defence systems were identified in the accessory region of an ICE-like element within the indicated genome. Homologous elements from other bacterial genomes contain known and putative defence systems in the same location. b, All identified instances of P2 defence hotspot #1 in our 73-strain E. coli collection. White genes are flanking conserved P2 genes. Each colour of gene within the hotspot represents a protein cluster (30% identity). All grey genes belong to a lone cluster. Double slashes denote the end of a contig. c, Number of defence and prophage-associated genes ±10 kb from system homologues. The scatterplots indicate, for each homologous system, the numbers of prophage and defence-associated genes within ±10 kb. Examples in c represent systems that were found outside of prophages in our genome collection. For all 21 systems, see Extended Data Fig. 5. d, Same as c but for systems we found in prophages. e, Examples of the ±10 kb context for PD-T7-1 homologues in a defence island or prophage. f, Distribution of the number of nearby defence-domain-containing genes in homologues of systems commonly found in prophages (>10% homologue-containing regions with 8+ prophage genes in proximity) or not; n = 12 and 9 systems, respectively. Boxes indicate bounds of the distribution as median ± quartiles, and limits exclude outliers. g, Linear least squares regression for total nearby prophage gene and defence-domain-containing genes for each system. Pearson r = −0.442, P = 0.045; error indicates 95% CI.

