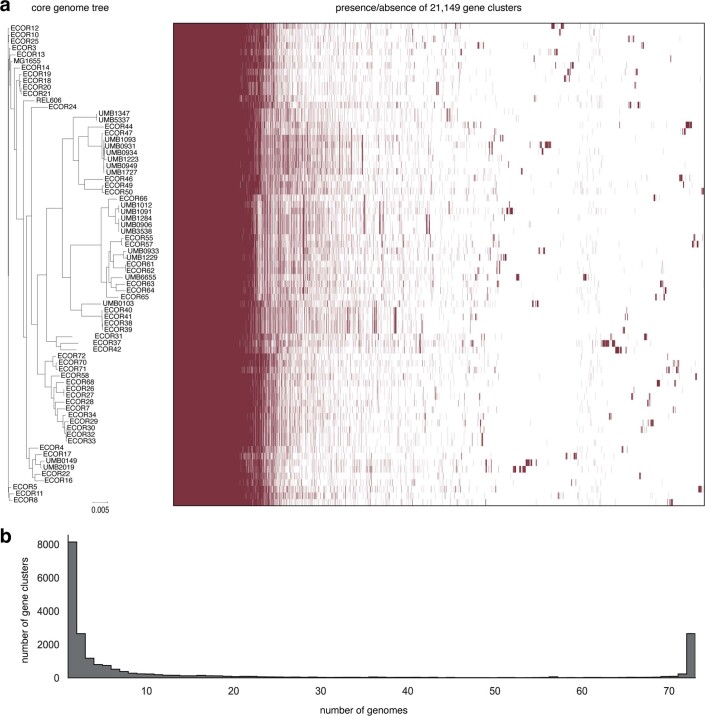
Extended Data Fig. 1. Diversity of the E. coli isolate pangenome used in this study.
(a) (Left) Phylogenetic tree of E. coli strain collection used to construct the genomic library screened. E. coli K-12 (MG1655) and B (REL606) are also included. (Right) Bars indicate presence/absence (red/white) of individual gene clusters (95% identity threshold). (b) Plot of the number of gene clusters versus the number of strains they are found in, for example ~8,000 clusters are each found in only one genome. These sparsely conserved clusters represent the accessory genome, whereas ~3,000 clusters are found in all 73 genomes and represent the E. coli core genome.

