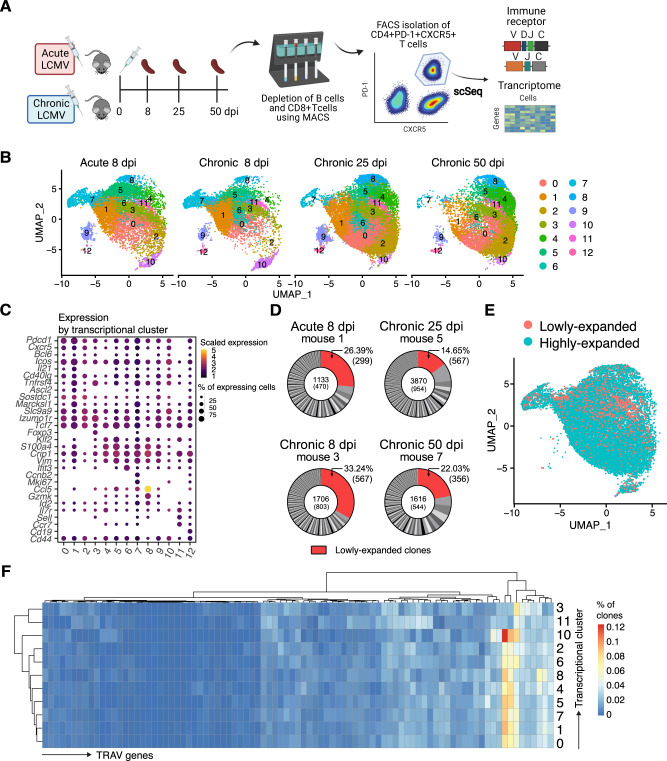
Fig. 1. Different transcriptional phenotypes emerge in polyclonal Tfh cell populations following acute and chronic LCMV infection.
A Experimental setup. CD4+CXCR5+PD-1+ cells were isolated from spleens of C57BL/6 mice infected with acute LCMV (n = 2) or chronic LCMV infection (n = 6). Each time point included two biological replicates. Cells were then sorted and sequenced to obtain both transcriptomes and TCR repertoires. B Uniform manifold approximation projection (UMAP) separated by experimental group. C Dottile plot depicting scaled expression of genes of interest separated by transcriptional clusters. D Representative donut plots depicting distribution of clonal expansion in each infection time point. Each section corresponds to a unique clone (defined by CDR3α-CDR3β nucleotide (nt) sequence) and the size corresponds to the fraction of cells relative to the total repertoire. Lowly-expanded clones (supported by only one unique cell) are colored in red. E UMAP displaying clonal expansion of Tfh cells after acute and chronic infection. Clones are defined by CDR3α-CDR3β nt sequence. Lowly-expanded clones are represented by only one unique cell, while highly-expanded clones are supported by more than one cell. F Heatmap depicting percentage of clones (defined by CDR3α-CDR3β nt sequence) using a particular TRAV gene (columns) in each cluster (rows).

