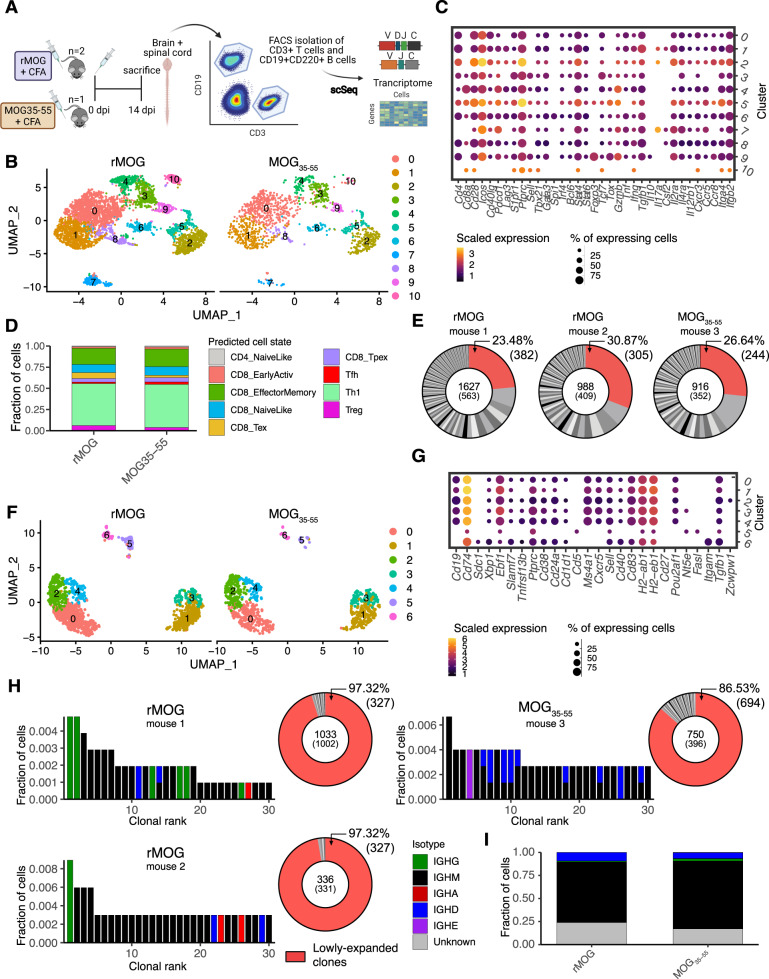
Fig. 6. Transcriptional similarity of B and T cells following experimental autoimmune encephalomyelitis (EAE) induction with either rMOG and MOG33-55.
A Experimental setup of single-cell immune repertoire sequencing. CD3+ T and CD19+CD220+ B cells were isolated from mice immunized with either recombinant myelin oligodendrocyte protein extracellular domain aa1-121 (rMOG, n = 2) or the peptide MOG35-55 (n = 1), after 14 days. B Uniform manifold approximation projection (UMAP) of T cells split by immunization type. C Dottile plot showing genes of particular interest in all clusters arising from unsupervised clustering in T cells. D Fraction of T cells belonging to predicted cell state using the nearest-neighbor classifier of the ProjecTILs algorithm [54] for both groups. E Donut plots representing clonal expansion of T cells. Each section corresponds to a unique clone (defined by CDR3α-CDR3β nt sequence) and the size corresponds to the fraction of cells relative to the total repertoire. Lowly-expanded clones (supported by only one unique cell) are colored in red. F Uniform manifold approximation projection (UMAP) of B cells split by experimental group. G Dottile plot showing genes of particular interest in all clusters arising from unsupervised clustering in B cells. H Top 30 most expanded B cell clones of mice immunized with either rMOG or MOG35-55 colored by isotype. Distribution of clonal expansion is represented by donut plots. Each section corresponds to a unique clone (defined by CDRH3-CDRL3 nt sequence) and the size corresponds to the fraction of cells relative to the total repertoire. Lowly-expanded clones (supported by only one unique cell) are colored in red. I Fraction of B cells corresponding to a specific isotype. Cells with either less or more than one heavy and one light chain were assigned an “unknown” isotype.

