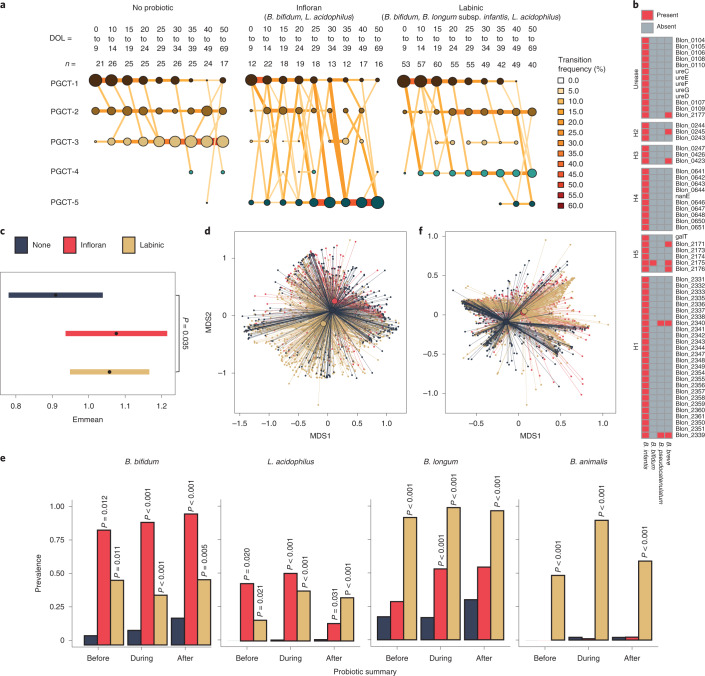
Fig. 3. Probiotics were the most significant co-variate associated with the microbiome of preterm infants.
a, Transition model showing the progression of samples through each PGCT from DOL 0 to DOL 69, based on probiotic type. The nodes and edges are sized based on the total counts; nodes are coloured according to PGCT and edges by the transition frequency. b, Prevalence of the B. infantis HMO gene clusters among other species. c, Estimated marginal means (95% CIs) representing Shannon diversity for each probiotic type, obtained from the Shannon diversity linear mixed-effects model adjusted for gestational age, birthweight, birth mode, sex, season, antibiotics, day of full feed, MOM, BMF, formula, weight z-scores, DOL and patient ID. The statistical significance shown is after adjustment for multiple comparisons using two-tailed Tukey’s HSD method. d, NMDS plot of taxonomic profiles for all samples (n = 1,431), showing the mean centroid for each probiotic type. e, Prevalence of probiotic species before, during and after probiotic treatment, stratified by probiotic type. Samples from infants who took no probiotic have been subset into three discrete time bins based on the average start and stop days for probiotic treatment (8 DOL and 44 DOL, respectively). The statistical significance shown is within probiotic summary groups (that is, before, during and after) following adjustment for multiple comparisons using Dunnett’s method, whereby samples from infants who took no probiotic were used as the control for each group. f, NMDS plot of EC number profiles for all samples (n = 1,431) showing the mean centroid for each probiotic type.

