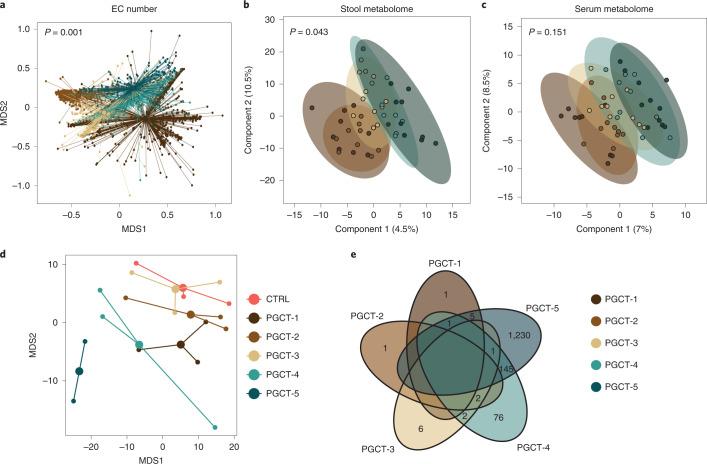
Fig. 4. Functional implication of PGCTs.
a, NMDS plot of EC number profiles for all samples (n = 1,431) showing the mean centroid for each PGCT. The statistical significance was based on PERMANOVA, with permutations constrained within the patient. b,c, PLS-DA plots of metabolite profiles (n = 50) showing 95% confidence ellipses for each PGCT for stool (b) and serum (c). The statistical significance was based on PERMANOVA. d, NMDS plot of preterm intestinal organoid transcriptome profiles (n = 17; 2–3 per group) showing the mean centroid for each PGCT. CTRL, control. e, Venn diagram showing the number of DEGs compared with control for each PGCT. Zero values were removed for clarity.

