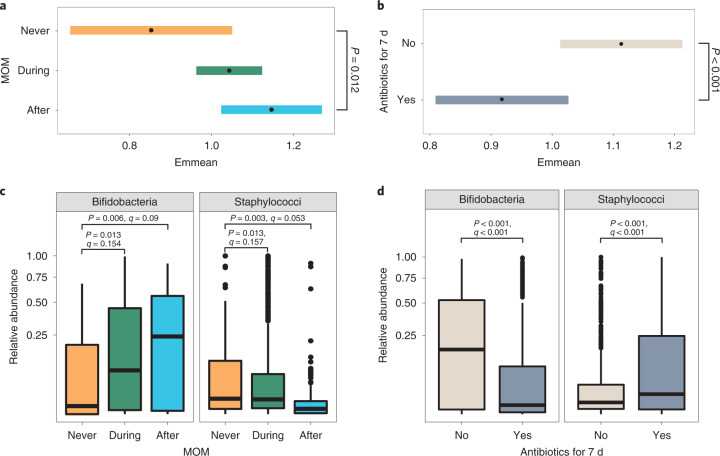
Fig. 5. MOM and antibiotics are significantly associated with the preterm gut microbiome.
a,b, Estimated marginal means (95% CIs) representing Shannon diversity for MOM (a) and antibiotics (b), obtained from the Shannon diversity, linear, mixed-effects models adjusted for gestational age, birthweight, birth mode, sex, season, day of full feed, BMF, formula, probiotics, weight z-scores, DOL and patient ID. The statistical significance shown is after adjustment for multiple comparisons using the two-tailed Dunnett’s method, whereby ‘never’ or ‘no’ was used as the control, respectively. c,d, Box plots showing the relative abundance of bifidobacteria and staphylococci in all samples (n = 1.431) across MOM (c) and antibiotic (d) groups. The centre lines denote the median, the box limits denote the IQR and the whiskers extend to the limits. Points outside the whiskers represent outliers. Statistical significance is based on P values and q values obtained from MaAsLin2 analysis.

