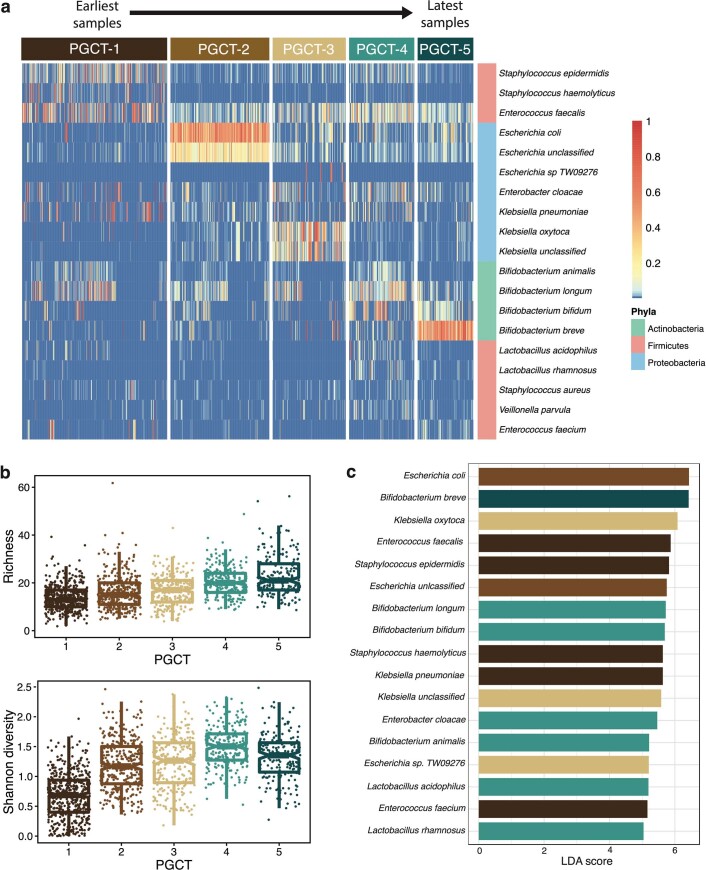
Extended Data Fig. 2. DMM clustering into PGCTs.
a, Heatmap of all samples (n = 1431) showing the relative abundance of the most dominant species, coloured by phyla, stratified by PGCT. b, Box plots showing the alpha diversity (richness and Shannon diversity) for each PGCT. The centre line denotes the median, the box limits denote the inter-quartile range (IQR) and whiskers extend to the limits. c, LEfSe identifying discriminatory features of each PGCT based on Linear Discriminant Analysis (LDA). Coloured bars denote PGCTs.

