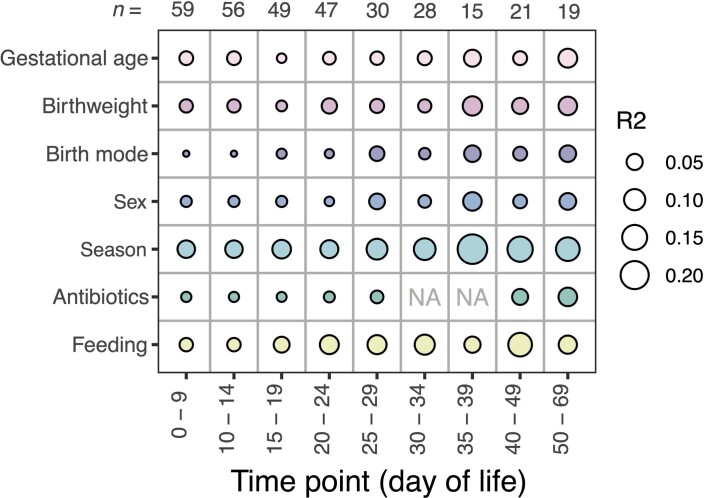
Extended Data Fig. 3. Explained variance of 7 clinical co-variates at different timepoints to validate the findings in this study, using a published metagenomic dataset from Olm et al14., modelled by ‘adonis’.
Bubbles show the amount of variance (R2) explained by each covariate at a given timepoint. NA values are used when analyses could not be carried out, due to only 1 level of the variable existing in that given timepoint. No results were found to be significant based on taxonomic profiles at the species level.

