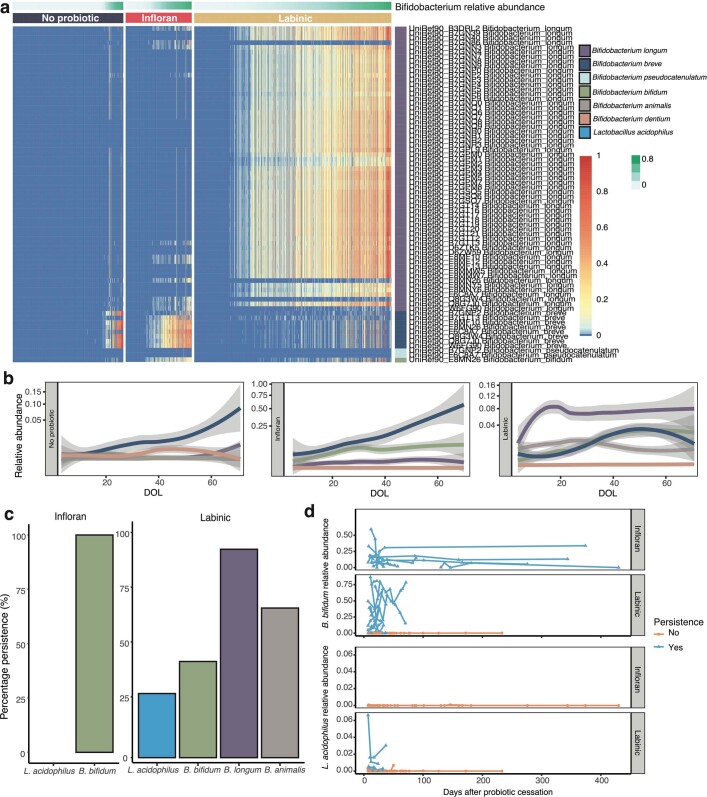
Extended Data Fig. 4. The individual impact of probiotics and probiotic species on the gut microbiome.
a, Heatmap showing the relative abundance of B. infantis HMO genes and homologs in other species, coloured by species and stratified by probiotic type. b, Locally weighted scatterplot smoothing (LOESS) fit (95% confidence intervals shaded in grey) over time for the top 5 most dominant Bifidobacterium spp. c, Percentage persistence of probiotic species in Infloran® and Labinic™. d, Per-infant per-strain longitudinal abundance of probiotic species in Infloran® and Labinic™ following the cessation of probiotics.

