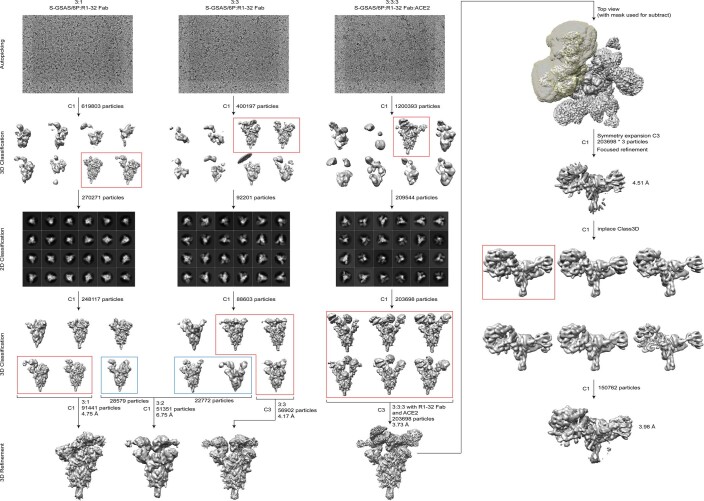
Extended Data Fig. 3. Cryo-EM data processing flow-chart.
Pipelines are illustrated for the 3:1, 3:3 spike protomer:R1-32 Fab and the 3:3:3 spike protomer:R1-32 Fab:ACE2 datasets. After automated picking, 3D and 2D classification steps were used to remove contaminating objects. 3D classification was subsequently used to sort the data into different structures. The structure of the RBD:R1-32 Fab:ACE2 portion was further improved with focused refinement centred at the RBD.

