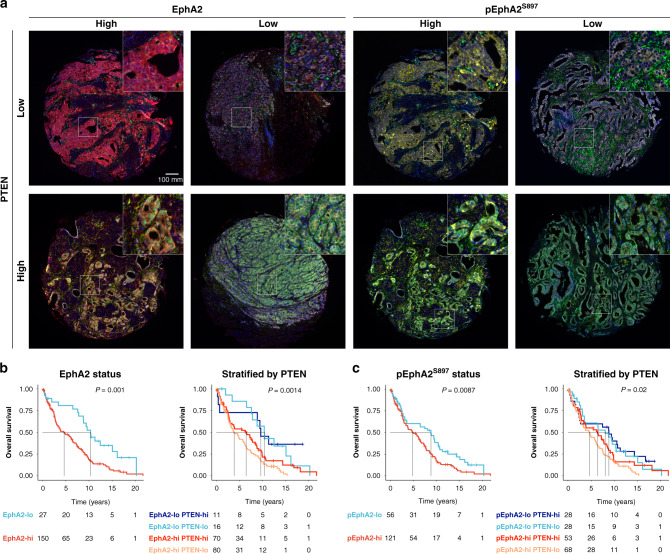
Fig. 3. EphA2hi and pEphA2S897hi status are associated with poor overall survival in an unselected PCa TMA cohort.
a Composite multiplex fluorescence images of representative TMA cores based upon EphA2 (red), pEphA2S897 (yellow) and PTEN (green) expression status. b Kaplan–Meier overall survival curves stratified by either EphA2 status alone or EphA2 and PTEN status. c Kaplan–Meier overall survival curves stratified by either pEphA2S897 status alone or pEphA2S897 and PTEN status. The black dotted line represents median survival. P value denotes the result of the log-rank test.

