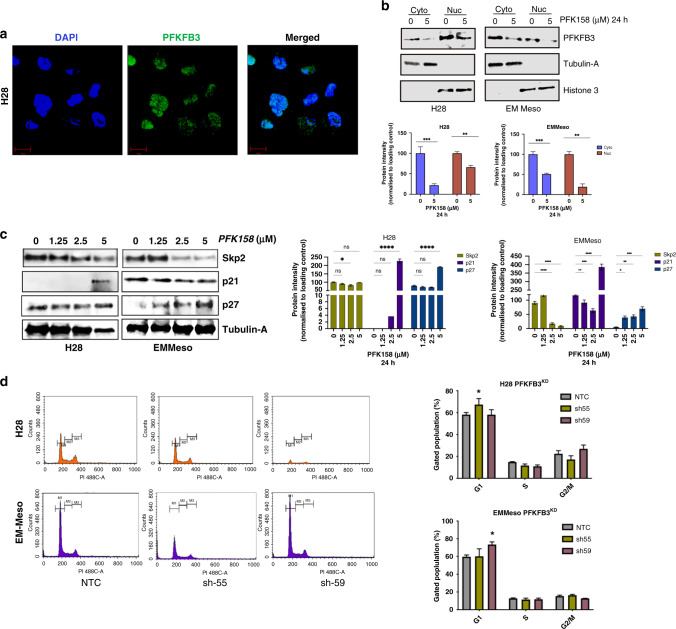
Fig. 4. MPM cells show the nuclear localisation and function of PFKFB3.
a A representative fluorescent microscopic image of nuclear localisation of PFKFB3 in H28 cells. b Upper: Subcellular fractionation followed by immunoblotting of PFKFB3 with proper cytosolic (Tubulin-A) and nuclear (Histone3) control in H28 and EMMeso cells. Lower: Bar diagram of PFKFB3 amount normalised to the respective subcellular control. c Left: Western blot analysis of the alteration of some nuclear proteins involved in cell cycle regulation in H28 and EMMeso cells after PFK158 treatment for 18 h. Right: Graphical representation of quantification of proteins normalised to control. c Cell cycle analysis through PI staining followed by flow cytometry in H28 and EMMeso NTC, sh55 and sh59 clones. Representative data of three individual sets of experiments. d The quantitative measurement of cell cycle phases in both the cell lines. Data showed the percentage of the gated population of each phase. **P < 0.001, *P < 0.01.

