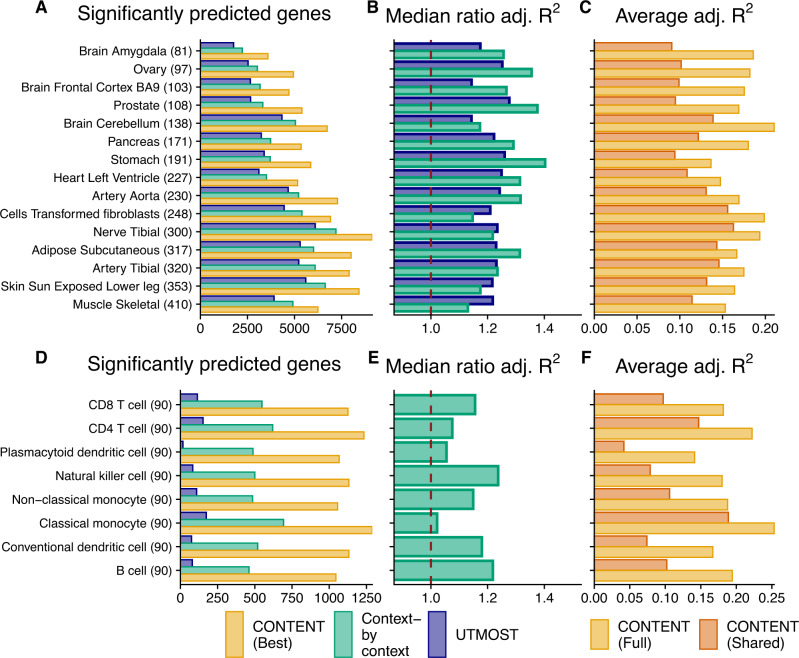
Fig. 3. CONTENT outperforms existing approaches in the GTEx and scRNA-seq CLUES datasets.
A, D Number of genes with a significantly predictable component (hFDR ≤ 5%) in GTEx (A) and CLUES (D); the sample sizes for each context are included in parentheses. B, E Ratio of expression prediction accuracy (adjusted R2) of the best-performing cross-validated CONTENT model over the context-by-context (green) and UTMOST (blue) approaches (median across all genes significantly predicted by at least either method). Numbers above one indicate higher adjusted R2 and thus prediction accuracy for CONTENT. C, F Prediction accuracy of CONTENT(Full) and CONTENT(Shared) when a gene-tissue has a significant shared, specific, and full model.

