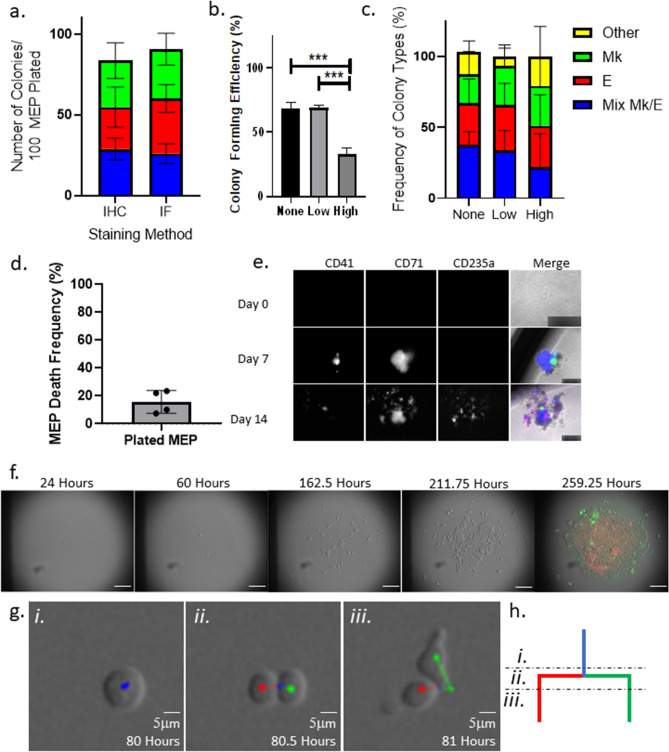
Figure 1.
Approach setup. (a) In situ immunofluorescence staining detects a similar number and ratio of colony types derived from individual MEPs. MEP CFU assays grown for 14 days were stained using either the traditional immunohistochemistry protocol or the in situ immunofluorescence protocol. Colonies were categorized based on the presence of cells stained with antibodies against lineage-specific markers. Three colony types were scored: Mk/E mixed colonies (blue), E-only colonies (red), Mk-only colonies (green). The average absolute colony counts per 100 plated MEPs by type are presented in stacked bar graphs. n ≥ 5. Mean and SD indicated. (b) MEP phototoxicity is avoided by reducing initial imaging frequency. Colony forming efficiency of MEPs grown for 7 days, calculated by the number of colonies observed out of the total plated cells is represented in the bar chart according to image acquisition settings. “None” represents colonies grown in the absence of imaging. “Low” represents colonies grown in the absence of imaging for the first 24 h, followed by imaging every 2 h for the next 36 h, and finally imaging every 10 min for the duration of colony growth. “High” represents colonies grown in the absence of imaging for the first 24 h followed by imaging every 10 min for the duration of colony growth. n ≥ 3; ***p < 0.01. Mean and SD indicated. (c) Low imaging frequency does not alter ratio of colony types grown from individual MEPs. Colony count normalized to the total number of colonies grown in each of the acquisition conditions. n ≥ 3; ***p < 0.01. Mean and SD indicated. (d) Frequency of MEP death with low imaging frequency. MEP death frequency was calculated as the number of MEPs that failed to give rise to a colony as observed in timelapse acquisitions normalized to the total number of imaged MEPs. n = 4. Mean and SD indicated. (e) Representative clonally growing MEPs stained with fluorescently conjugated anti-CD41, anti-CD71, and/or anti-CD235a during colony growth. Individual MEPs and colonies grown from individual MEPs were stained in situ with fluorescently conjugated antibodies against lineage markers at day 0, 7, and 14 of the CFU assays. Representative images of cells and colonies at the respective time points are shown for each channel (marker) and merged. Scale bars are set to 50 µm for day 0 and 250 µm for days 7 and 14. (f) Representative time-lapse sequence of an individual MEP forming a colony and in situ stained with anti-CD41 and anti-CD71. Selected time points during the acquisition are shown to demonstrate colony growth from an individual MEP. Scale bar = 100 μm. (g) Tracking MEP mitotic events with the Baxter algorithm. A representative image sequence capturing a tracked bipotent progenitor (i) undergoing cytokinesis (ii) and separating into daughter cells (iii). Scale bar = 5 μm. (h) Example of lineage tree branching reflecting a mitotic event. Illustration of lineage branching built by single-cell tracking of time-lapse sequences. Blue line represents a bipotent progenitor. Red line represents an E-destined daughter cell. Green line represents an Mk-destined daughter cell. Subsections of the lineage branch correspond with the representative tracked cells in (g).

