Figure 2.
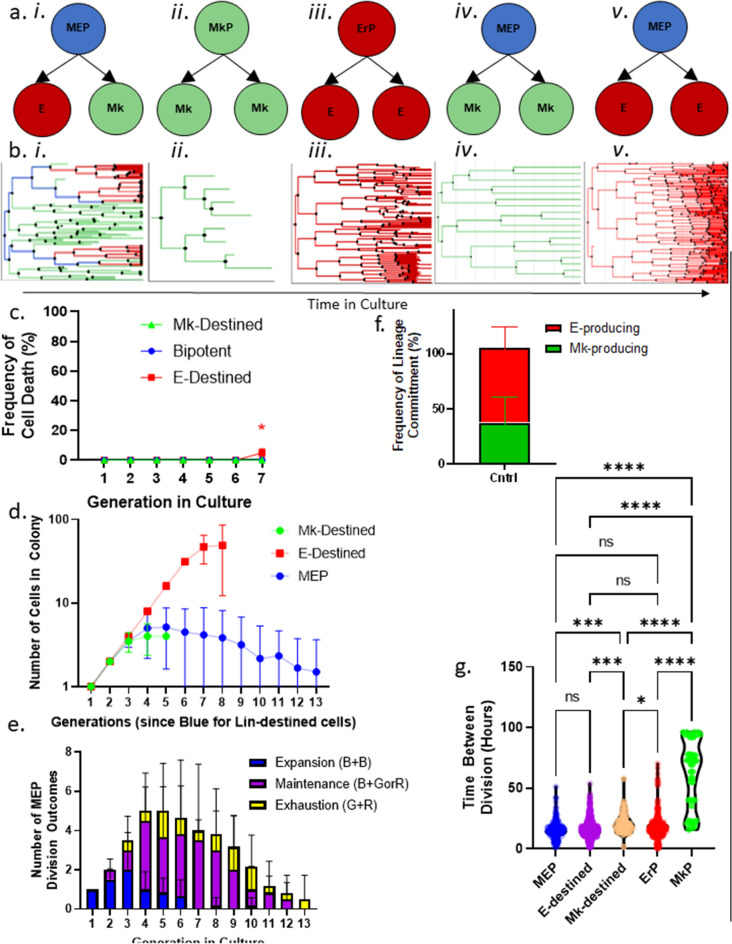
Growth and differentiation. (a) Schematic representations of the sorted progenitors and resulting colony types. (i) Sorted MEPs that give rise to an Mk/E mixed colony. (ii) Sorted MkPs that give rise to an Mk-only colony. (iii) Sorted ErPs that give rise to an E-only colony. (iv) Sorted MEPs that give rise to an Mk-only colony. (v) Sorted MEPs that give rise to an E-only colony. (b) Corresponding representative lineage trees for each colony output. Blue lines represent MEPs, red lines represent E-destined cells, and green lines represent Mk-destined cells. Italic roman numerals correspond with (a). (c) Cell death rate by cell state in control culture conditions. Blue points represent bipotent cells (n = 222). Red points represent E-destined cells (n = 2035; p < 0.017). Green points represent Mk-destined cells (n = 165). Mean and SD indicated. (d) Expansion rates of cell types in time-lapse CFU assays. Cell number at each generation by cell state: MEP (blue), Mk-destined (green), and E-destined (red) cells grown in control conditions over 13 divisions (n = 6 movies). Mean and SD indicated. (e) Division outcomes by generation in culture. Absolute number of MEP division outcomes by generation in culture categorized as expansion (blue: 1 MEP → 2 MEP), maintenance (purple: 1 MEP → 1 MEP + 1 E- or Mk-destined progenitor), or exhaustion (yellow: 1 MEP → 1 E-destined progenitor + 1 Mk-destined progenitor) (n = 6 movies). Mean and SD indicated. (f) Frequency of MEP lineage commitment. Frequency of lineage commitment was calculated as the number of E- or Mk-destined daughter cells produced by MEPs in control timelapse CFU conditions (n = 6 movies). Mean and SD indicated. (g) Lifespan of cell states. Lifespan of cells categorized by state as defined in the timelapse CFU assays was measured by time between divisions in hours of bipotent MEP (blue; n = 188), E-destined (purple; n = 964), Mk-destined (orange; n = 49), committed ErP (red; n = 505), and committed MkP (green; n = 47) cells. *p < 0.05, **p < 0.01, ***p < 0.001, ****p < 0.0001, ns not significant.

