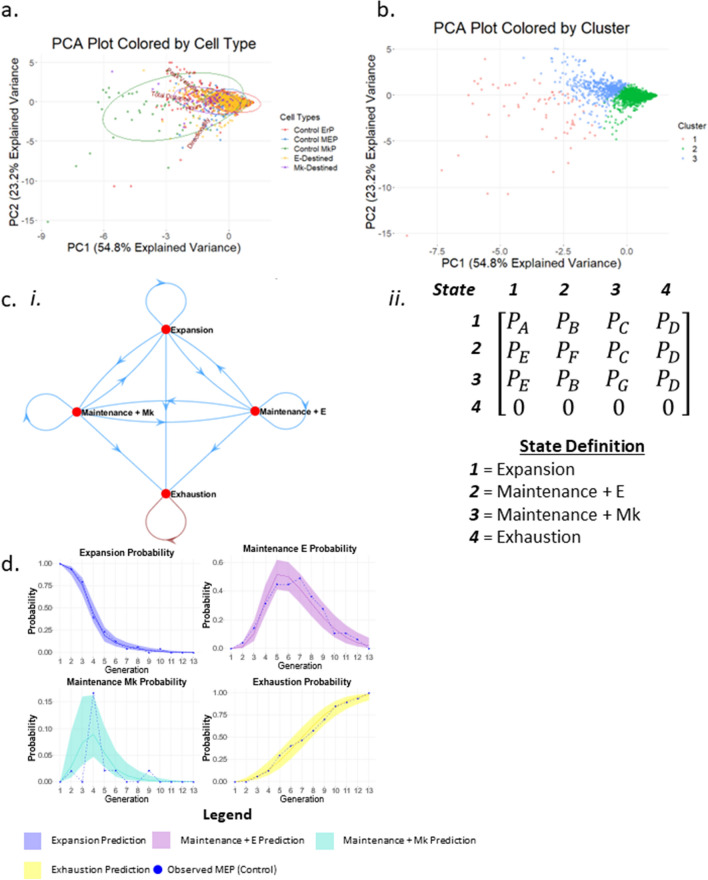
Figure 4.
Quantitative behavioral phenotypes predict cell state. (a) Clustering of cells based on multi-dimensional analysis. Individual cells are graphed on PCA plots based on all quantified behavioral phenotypes (peak velocity, total distance, lifespan, and directionality) and color coded based on cell state: bipotent MEP (blue), E-destined (orange), Mk-destined (purple), committed ErP (red), and committed MkP (green). (b) k-means clustering of PCA plots. Three clusters were generated by k-means clustering. (c) Markov chains depicting cell state transitions of MEPs in CFU culture conditions. (i) Markov chains most accurately encompass the cell state transitions MEPs were observed to undergo. States include expansion, maintenance + E, maintenance + Mk, and exhaustion. (ii) The matrix used to derive the mathematical model to predict MEP state transitions. (d) Probability of MEP state transitions. The probability that MEPs will undergo four division types (expansion, maintenance + E, maintenance + Mk, exhaustion) by generation in culture is represented by the solid lines in each graph with a 95% confidence interval represented by the colored shadowed regions. Actual observed frequencies of each division outcome by generation are depicted by the dotted lines.

